A full blown bear market in energy resources and energy stocks has been underway since mid-2014. History shows that the price of crude oil typically bottoms before the broad stock market. And oil related stocks bottom at the same time or later than the broad market. The monthly chart below shows how oil bottoms several months before the stock market does. This provides us with some insight on when we should start to expect a bear market to end in the US stock market.
Many traders follow and trade shares of Exxon Mobil. And while the are big money maker I do feel their share price is going to underperform oil for some time. Based on my research XOM has acquired many new oil operations, which many require $70+ per barrel to be profitable. This has cost XOM a considerable amount of capital and is now left holding and operating business that are losing money with the current price of oil sub $40 per barrel.

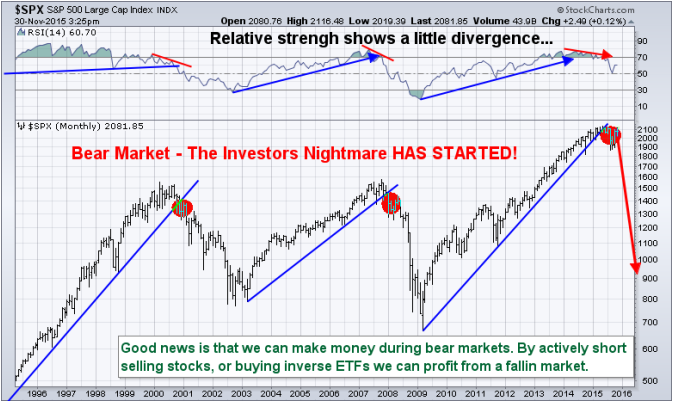
Base on my analysis, economic data and forecast I feel as though oil will remain low for another 3-9 months below $60 per barrel. It will do this for several reasons but what matter to us is that it forced the majority of oil producers to cap and close off well and go out of business. While this is taking place stocks and the economy will rebalance through a strong economic recession and a bear market in equities that will last most if not longer than 2016. Take a look at the US stock market average (SP500 index) in the chart below. While this chart is a very basic and simple looking forecast understand that the stock market internals and market breadth have completely collapsed just s we saw in 2000 and again in 2008 months before the index collapsed and started bear markets.

Oil, XOM, and Stock Trading Conclusion:
In short, I expect oil to find a bottom during the next 1-3 months. Oil services stocks on average are likely to trade sideways and build a basing pattern. These oil services stocks will not breakout and rally until the broad stock market has bottomed which I expect to happen late in 2016 or early 2017. Unfortunately, oil and oil stocks collapsed so fast without any retest or pause for us to get short and enjoy the ride down for profits. I feel trading oil and oil stocks will be choppy and tough in the near year. Last week subscribers and I played the energy (XLE) for a quick two-day pop of 2-4% return depending on entry and exit. These types of plays will continue, but the big trend trade in oil and energy are a long way away yet.
The easier money will be likely be shorting the stock market (buying inverse ETFs) to profit as stocks collapse which is what I provide subscribers to my ETF trade alert newsletter.
Chris Vermeulen – www.The Gold & Oil Guy.com
Get our latest FREE eBook "Understanding Options"....Just Click Here!

1 comment:
Looking at RSI on SPX monthly, it began diverging downwards in 98 for several years during ramp into spring 2000 top. So (unfortunately) divergences can last much longer than expected.
But I appreciate your comments on correlation with oil. I think your idea that majors like XOM lag because of their acquisition of weakened assets is spot on.
Post a Comment