Showing posts with label Bear Market. Show all posts

Wednesday, May 20, 2020

How You Can Prepare for a Bear Market/Economic Reset

Virus cases are starting to show up in other countries with Brazil spiking this week and China warning the virus is mutating quickly and in a very bad way.

We are expecting terrible retail sales for another quarter, they are currently worse than 1992, and manufacturing numbers will be horrible again as well. More negatives are starting to show up again for stock prices and investors hence the recent correction.

It does not matter what the markets do going forward. A new bull market or bear market won't catch us off gauge as technical traders. Why? Because we follow price, not predict and bet on predictions. If you want to learn how follow the markets to trade and invest with a simple step by step strategy we provide that here in this 30 page guide and show you what charts and indicators to follow.

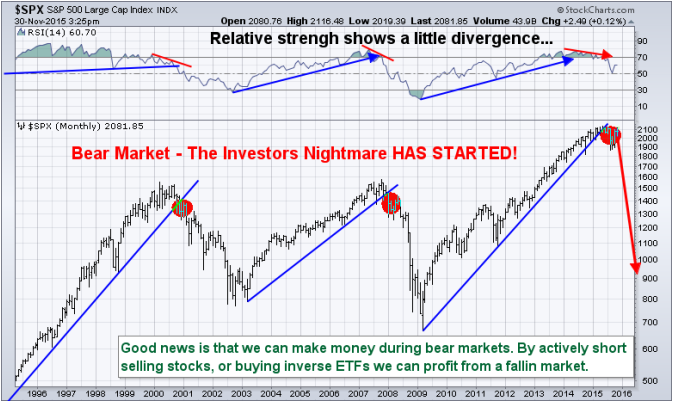
Don't get me wrong, I would actually prefer a bear market because so much more money can be made in a short period of time, plus we would have the opportunity to re-invest our money into companies with high growth potential and dividends for pennies on the dollar.

We had a big reversal candle on the weekly chart after the stock indexes hit both price and Fibonacci resistance, and the Fed trimmed back on market stimulus last week. This is a Fed induced rally, which, if you ask me, is a dead cat bounce before things get really ugly once this bounce fizzles out.

My research team issues a major "Black Swan" warning on February 21, 2020 – just four days before the start of the current market collapse. Now, we are issuing a "bottom" call near a specific date in the future. This means incredible opportunities for skilled technical traders/investors that know how to trade in this increased volatility.

When is the bottom supposed to happen, and where will it be priced? Those answers are only available to my members as it is specialized proprietary research. Still, even if you know when and where the bottom would likely be in the markets – what would you do differently today to attempt to profit from this incredible setup?


I've been trading the markets since 1997, and I've never seen anything like what is happening right now. Sure, I've seen numerous market events where risks appeared to be excessive, and there were incredible opportunities for traders using our market research and trade signals – but nothing compares to what is happening right now.

My research team has poured through months of data and run our advanced predictive modeling systems. We've mapped out various cycle events 200+ years into the future and can identify price/trend events based on our proprietary research tools. The alignment of major super cycles, minor cycles, global economic credit expansion, and the COVID-19 virus event, has created a once in a lifetime opportunity for all skilled traders and investors. I'm simply amazed that some of the best analysts on the planet continue to miss these big setups.

The bottom will happen, and we believe we've pinpointed a date range and price for the bottom in the global markets. After that, there is a specific process that the global markets will begin that will set up a once in a lifetime opportunity for skilled traders and investors. Trust us, very few people are prepared for these super cycle events or the associated price trends that are about to unfold.

Right now is when you want to start preparing for these events and these super cycles. This is truly a once in a lifetime event if you understand what is really happening to the global markets. The opportunities for you and your family are incredible – if you know how to play these cycle events. If you don't, then you will likely experience extreme difficulty in navigating the next 15+ years successfully.

Please visit The Technical Investor to learn more about our us and our investing portfolio newsletter. We are attempting to help you create massive opportunities from these major cycle/economic events and to help you preserve and protect your wealth.


Chris Vermeulen
Chief Market Strategist
The Technical Traders


Stock & ETF Trading Signals

Monday, November 26, 2018

Crude Oil and Bitcoin Hit New Yearly Lows

For the first time in a year WTI crude oil is traded below $54 a barrel hitting a low of $53.63. Oil fell as much as 6% as fears are surfacing that OPEC's planned production cuts will do little to stave off a surge in global stockpiles.

Bitcoin finally made a significant move to break out of the tight trading range that it had been trapped in. Unfortunately for Bitcoin bulls, it was not the move that they were looking for as it dropped almost 13% on Monday and continued lower Tuesday shedding another 4.8% to trade at the new yearly low of $4,547.00. The cryptocurrency is now down more than 60% year to date and more than 70% since its all time high. Where will it stop? $3000, $2000 or $1000?


Not to be outdone by oil and Bitcoin, stocks are all continuing the sell off that started Monday with the S&P 500 dropping 1.6%, the DOW is once again below 25k, shedding 2% and the NASDAQ is trading back below 7,000 losing 1.6%. The recent sell off has once again pushed the stock market back below the yearly open, shedding all of the gains that came with record highs earlier in the year which has driven all three indexes into correction/bear market territory. It's looking more and more like we have a good to chance to end the year lower unless we get the Santa Clause rally.

Jeremy Lutz
INO/MarketClub


Friday, November 23, 2018

Crude Oil and Bitcoin Hit New Yearly Lows

For the first time in a year WTI crude oil is traded below $54 a barrel hitting a low of $53.63. Oil fell as much as 6% as fears are surfacing that OPEC's planned production cuts will do little to stave off a surge in global stockpiles.

Bitcoin finally made a significant move to break out of the tight trading range that it had been trapped in. Unfortunately for Bitcoin bulls, it was not the move that they were looking for as it dropped almost 13% on Monday and continued lower Tuesday shedding another 4.8% to trade at the new yearly low of $4,547.00. The cryptocurrency is now down more than 60% year to date and more than 70% since its all time high. Where will it stop? $3000, $2000 or $1000?


Not to be outdone by oil and Bitcoin, stocks are all continuing the sell off that started Monday with the S&P 500 dropping 1.6%, the DOW is once again below 25k, shedding 2% and the NASDAQ is trading back below 7,000 losing 1.6%. The recent sell off has once again pushed the stock market back below the yearly open, shedding all of the gains that came with record highs earlier in the year which has driven all three indexes into correction/bear market territory. It's looking more and more like we have a good to chance to end the year lower unless we get the Santa Clause rally.

Jeremy Lutz
INO/MarketClub


Tuesday, January 19, 2016

Technical Evidence Indicates Major Price Movement Just Getting Started!

Stocks around the globe were pummeled again last week. This is no surprise to our subscribers as our predictive trend analytics model gave us clear technical evidence that important multi year highs had completed back in the middle of 2015. I continue to remain steadfastly bearish in my outlook for stocks.

Last Friday, January 15, 2016, the SPX broke below its Aug. 24, 2015 low, which is equivalent to a major sell signal if price closes the month below that level.

Last week, The Dow Jones Industrial Average slumped 511 points, or 3.1%, to 15,866, while the S&P 500 slid 64 points, or 3.4%, to 1,856.34, led by the financials, technology and energy sectors. The Nasdaq Composite tumbled 190 points, or 4.1%, to 4,424.35. Subscribers and I managed to catch a 33% quick intra-week bounce trading the SSO ETF and then got out of harm’s way as volatility took hold once again.

European stocks were unable to escape the downward trend from other markets, and the Stoxx Europe 600 index lost 2.8%. The dollar fell to a one-year low vs. the yen. Gold rose $22.40, or 2.1%, to $1,096.20 an ounce.

The SPX is currently testing major support. This is consistent with a “cycle low” that arrived over the weekend. Even though we are in a bear market, we should expect a “Bear Market Rally” sucking every last investor into long positions, before dropping much lower through previous support areas. This will be a very “short term bottom” this week.

We are in a long term downtrend now; it is not a “hiccup” as we experienced back in 2012.

If the stock market is going to stage a rally from here, this is a good time to start, right when everyone is jumping off the ship and the sentiment is so extremely negative. Just to give you a feel for the level of panic selling on Friday, my panic selling indicator which tells us when short term bottoms are likely to happen as everyone is running for the door, this contrarian indicator spiked to 50. Now any reading over 3 is panic in the market, and a reading of 9-18 is typically a multi week low. So you can see how 50 is VERY extreme.

Because we are entering a bear market and institutions will be unloading shares area record pace going forward, I feel this extreme level of panic selling (50) is only going to trigger a bounce lasting a week or so, then more distribution selling will take hold.

trap2
trap1


A slew of disappointing U.S. data shows that manufacturing and consumer spending are in trouble. Empire State factory index declined sharply this month to its lowest level since the recession. Retail sales declined by 0.1% in December 2015 and a report on industrial production compiled showed that activity declined for the third straight month.

The New Year is not off to good start. In fact, it may be the worst start ever of a New Year in many world stock indices. Instead off irrational exuberance that had previously been so evident, investors of world equity markets are clearly starting to panic. We all know things are not right. We know it hasn’t been okay since the 2008 financial crisis. The effort by the central banks to get over the hump has fueled an “Asset Bubble” in the stock markets.

This in turn should start to fuel safe haven buying in gold. Gold’s day in the sun is soon approaching. I believe this new year will prove to be a pivotal year for gold, silver and miners.

The “talking heads” tell us that the stock market is falling because energy prices are falling. We need higher energy (gasoline) prices. Really? They claim that energy companies are going out of business and that tens of thousands of people will lose jobs and unemployment will rise. Really? Didn’t the jobs numbers show hundreds of thousands of people getting new jobs – in fields outside of energy? Who are you going to believe?

Later this week I will be posting an exciting video show you how to make a fortune during this pending bear market and exactly how I did this in 2008 – 2012 to become financially free before I turned 30 years of age. Stay tuned and be sure to opt into my free email list if you want to see this exciting, inspiring and educational video!

Visit Here > www.Gold & Oil Guy.com 
Chris Vermeulen

Stock & ETF Trading Signals

Sunday, December 27, 2015

When Will They Bottom? Crude Oil, SP500, then ExxonMobil

A full blown bear market in energy resources and energy stocks has been underway since mid-2014. History shows that the price of crude oil typically bottoms before the broad stock market. And oil related stocks bottom at the same time or later than the broad market. The monthly chart below shows how oil bottoms several months before the stock market does. This provides us with some insight on when we should start to expect a bear market to end in the US stock market.
Many traders follow and trade shares of Exxon Mobil. And while the are big money maker I do feel their share price is going to underperform oil for some time. Based on my research XOM has acquired many new oil operations, which many require $70+ per barrel to be profitable. This has cost XOM a considerable amount of capital and is now left holding and operating business that are losing money with the current price of oil sub $40 per barrel.

Oil-98-Trader-XOM

Base on my analysis, economic data and forecast I feel as though oil will remain low for another 3-9 months below $60 per barrel. It will do this for several reasons but what matter to us is that it forced the majority of oil producers to cap and close off well and go out of business. While this is taking place stocks and the economy will rebalance through a strong economic recession and a bear market in equities that will last most if not longer than 2016. Take a look at the US stock market average (SP500 index) in the chart below. While this chart is a very basic and simple looking forecast understand that the stock market internals and market breadth have completely collapsed just s we saw in 2000 and again in 2008 months before the index collapsed and started bear markets.
Bear-Market2

Oil, XOM, and Stock Trading Conclusion:
In short, I expect oil to find a bottom during the next 1-3 months. Oil services stocks on average are likely to trade sideways and build a basing pattern. These oil services stocks will not breakout and rally until the broad stock market has bottomed which I expect to happen late in 2016 or early 2017. Unfortunately, oil and oil stocks collapsed so fast without any retest or pause for us to get short and enjoy the ride down for profits. I feel trading oil and oil stocks will be choppy and tough in the near year. Last week subscribers and I played the energy (XLE) for a quick two-day pop of 2-4% return depending on entry and exit. These types of plays will continue, but the big trend trade in oil and energy are a long way away yet.
The easier money will be likely be shorting the stock market (buying inverse ETFs) to profit as stocks collapse which is what I provide subscribers to my ETF trade alert newsletter.
Chris Vermeulen – www.The Gold & Oil Guy.com

Get our latest FREE eBook "Understanding Options"....Just Click Here!

Wednesday, December 4, 2013

Using Options to Capitalize on Strong Fundamentals for Gold

Our trading partners J.W. and Chris had a great discussion the other day which spurred to the creation of this interesting and educational gold futures trading article we wanted to share with you.

Throughout most of 2013, gold futures have been under major selling pressure. Gold opened the year trading around $1,675 per ounce. As of the 12/02/13 close, gold futures were trading around $1,220 per ounce which would mean that thus far in 2013, gold futures have lost more than 27% of their value.

Looking back to September of 2011, gold’s all time high came in around $1,923 per ounce. In a little more than 2 years, gold prices have dropped around $700 per ounce representing a total loss of more than 36% based on the 12/02/13 closing price. I would say most analysts would agree that gold has been in a bear market over the past two years.

Before we begin looking at a few ways to use the gold etf GLD option structures to take advantage of higher future prices in the yellow metal, I thought I would focus readers’ attention on some bullish fundamental data for gold. Let us begin with a chart of the Federal Reserve’s Total Assets which is shown here......

Read "Using Options to Capitalize on Strong Fundamentals for Gold"


Here's the Replay of this weeks free webinar "How to Boost Your Returns With One Secret ETF"


Sunday, March 3, 2013

Gold, Crude Oil & the SPX Trends and Setups

Over the past year our long term trends and outlooks have not changed for gold, oil or the SP500. Though there has been a lot of sideways price action to keep everyone one their toes and focused on the short term charts.

As we all know if the market does not shake you out, it will wait you out, and sometimes it will do both. So stepping back to review the bigger picture each weeks is crucial in keeping a level trading/investing strategy in motion.

The key to investing success is to always trade with the long term trend and stick with it until price and volume clearly signals a reversal/down trend. Doing this means you truly never catch the market top nor do you catch market bottoms. But the important thing is that you do catch the low risk trending stage of an investment (stage 2 – Bull Market, Stage 4 Bear Market).

Lets take a look at the charts and see where prices stand in the grand scheme of things.

Gold Weekly Futures Trading Chart:

Last week to talk about about how precious metals are nearing a major tipping point and to be aware of those levels because the next move is likely to be huge and you do not want to miss it.

Overall gold and silver remain in a secular bull market and has gone through many similar pauses to what we are watching unfold over the past year. As mentioned above the gold market looks to be trying to not only shake investors out but to wait them out also with this 18 month volatile sideways trend.

A lot of gold bugs, gold and stock investors of mining stocks are starting to give up which can been seen in the price and selling volume for these investments recently. We are contrarians by nature so when we see the masses running for the door we start to become interested in what everyone is unloading at bargain prices.

Gold is now entering an oversold panic selling phase which happens to be at major long term support. This bodes well for a strong bounce or start of a new bull market leg higher for this shiny metal. If gold breaks below $1500 – 1530 levels it could trigger a bear market for precious metals but until then we're bullish at this price. We think we could see another spike lower in gold to test the $1500- $1530 level this week but after that it could be off to the races to new highs.

GoldWeekly 

Crude Oil Weekly Trading Chart:

Crude oil had a huge bull market from 2009 until 2011 but since then has been trading sideways in a narrowing bullish range. We expect some big moves this year for oil and technical analysis puts the odds on higher prices. If we do get a breakout and rally then $130 will likely be reached. But if price breaks down then a sharp drop to $50 per barrel looks likely.

OilWeekly

Utility & Energy Stocks – XLU – XLE – Weekly Investing Chart

The utility sector has done well and continues to look very bullish for 2013. This high dividend paying sector is liked by many and the price action speaks for its self. If the overall financial market starts to peak then these sectors should hold up well because they are services, dividend and a commodity play wrapped in one.

XLURally
XLERally 

SP500 Trend Daily Chart:

The SP500 continues to be in an uptrend which we are trading with until price and volume tells us otherwise. But there are some early warning signs that another correction or a full blown bear market may be just around the corner.

Again, sticking with the uptrend is key, but knowing what to look for and prepare for is important so that when the trend does change your transition from long positions to short positions is a simple measured move in your portfolios.

SPYTrend

Weekend Trend Conclusion:

In short, we remain bullish on stocks and commodity related stocks until I see a trend change in the SP500.

Energy sector is doing well and looks bullish for the next month. As for gold and gold miners, we feel they are entering a low risk entry point to start building a new long position. Risk is low compared to potential reward.

When the price of a commodity or index trade near the apex of a narrowing range or major long term support/resistance level volatility typically increases as fear and greed become heightened which creates larger daily price swings. So be prepared for some turbulence in the coming weeks while the market shakes things up.

If you like our work then be sure to get on our free mailing list to get these emails each week on various investments and investment ideas.


Get our Free Trading Videos, Lessons and eBook today!


Tuesday, October 25, 2011

Gold, Natural Gas and Crude Oil all Close Higher on Tuesday

Crude oil closed up $1.92 a barrel at $93.20 today. Prices closed near mid range today and hit another fresh 11 week high. Crude bulls have gained solid upside near term technical momentum this week as prices have seen a bullish upside “breakout” from what was a well defined sideways trading range on the daily bar chart.

Natural gas closed up 5.6 cents at $3.85 today. Prices closed nearer the session high today on short covering in a bear market. The bears still have the solid overall near term technical advantage as prices are still down near the contract low.

Gold futures closed up $47.20 an ounce at $1,699.70 today. Prices closed nearer the session high today and hit a fresh four week high on a surge of safe haven demand amid fresh US debt crisis uncertainty. Bulls today gained fresh upside near term technical momentum to re establish a four week old uptrend on the daily bar chart.

Monday, June 13, 2011

Chris Vermeulens Stocks & Commodity Technical Trading Outlook For Summer 2011

Do you have a plan for trading summer 2011? Are you sticking to the usual "sell in May and go away"? Today Chris Vermeulen of The Gold and Oil Guy.Com gives us plan for trading the summer of 2011......

The coming summer should be exciting for traders! While summer trading generally tends to be slow, this one could be different. A large number of other professional traders I talk with are all feeling the tension building in the market. We all think some big movements are just around the corner and the big question is which way are things going to move?

Depending on your trading style you may be viewing the recent market action as the beginning stages of a bear market (major sell off). A bear market is not necessarily impossible as the U.S. Economy is showing the beginning signs of weakness. The fact that stocks have moved lower for almost 6 weeks straight is a recent reminder that we may not be out of the woods just yet. The recent price action and negative sentiment has been harsh enough to make 99% of traders bearish.

In contrast, some traders may be seeing this market as an oversold dip preparing for a bounce/rally in the bull market which we have been in since 2009. Some traders may see this as a buying opportunity because you are a contrarian. Most contrarians generally want to do the opposite of the masses (herd) who are merely trading purely out of emotional sentiment.

I myself have mixed thoughts on the market at this point in time. I’m not a big picture (long trend forecasting) kind of guy but my trading partner David Banister is great at it. Rather I am a shorter term trader catching extreme sentiment shifts in the market with trades lasting 3-60 days in length. So looking forward 2-5 days I feel as though stocks and commodities are going to bottom and start to head higher for a 2-6% bounce. At that point we need to regroup and analyze how the market got there… Was the buying coming from the herd, institutions, or was it just a short covering rally? Additionally, where are the key resistance levels and did we break through any?

During extreme sentiment shifts in the market we tend to see investments fall out of sync with each other for a few days. I feel the attention will be on stocks and we get a bounce this week. I am expecting commodities to trade relatively flat during the same time period.

OK let’s take a quick look at the charts…

Dollar Index 4 Hour Candles
I feel as though the US Dollar is trying to bottom. It is very possible that we test the May low at which point I would expect another strong bounce and possible multi-month rally. So if the dollar drops to the May lows then we should see higher stocks and commodities, but once the dollar firms up and heads higher it will be game over for risk assets.


Crude Oil Chart – Daily
Oil took a swan dive in early May and has yet to show any signs of moving higher. Actually crude oil is looking more and more bearish as time goes by.


Silver 4 Hour Chart
Silver has formed much of the same pattern that oil has. On a technical basis its pointing to sharply lower prices still. The fact that silver bullion went from an investment to a speculative trading instrument within the past 8 months makes me think it could test the $25 area. The one thing to remember here is that silver is still overall in a bull market. This is a 50/50 guess in my opinion as it nears the apex of this pennant pattern.


Gold 4 Hour Chart
Gold has held up much better than other metals and commodities and I feel that is because it’s still seen at the REAL safe haven. But reviewing the chart Im starting to see bearish price action beginning to take place.


SP500 Futures – 10 Minute Chart Going Back 8 Days
Last week the SP500 continued to show signs of weakness. Any bounce in the market was on light volume and that is because the sellers took a break and let all the small traders buy the market back up. But once the market moved up enough then sellers jumped back in and unloaded their shares.

Last Thursday I sent out an update to members pointing out that lower prices were to be expected. I came to this conclusion because of many data points. Looking at the chart you can see sellers are clearly in control. The SP500 bounces high enough that it reached a key resistance levels going back 5 days. Also the 200 period moving average was at that level. To top that off my sentiment reading for the herd mentality was at a point which sellers like to start dumping their shares again.


Weekly Market Trading Conclusion:
In short, I am getting more bullish for a bounce as the market falls. But once we are into day 3 or 4 of a bounce we must be ready to take profits and/or look for a possible short setup.

Get Chris' free weekly reports at The Gold and Oil Guy.Com


Share

Tuesday, September 1, 2009

Markets Close Sharply Lower, Bulls Still Have Slight Advantage Near Term


The U.S. stock indexes closed solidly lower today. The stock index bulls still have the slight overall near term technical advantage, but are fading heading into the historically bearish months of September and October.

Crude oil closed down $1.70 at $68.26 a barrel today. Prices closed near the session low today, hit a fresh three week low and were pressured by a big sell off in the U.S. stock market and a stronger U.S. dollar. Crude bulls and bears are on a level near term technical playing field.

Natural gas closed down 15.5 cents at $2.822 today. Prices closed near the session low today and did notch another fresh contract and seven year low. The bears are still in firm technical control. There are still no early technical clues of a market low being close at hand.

The U.S. dollar index closed up 59 points at 79.11 today. Prices closed nearer the session high today. Short covering in a bear market was featured. Bears still have the overall near term technical advantage.

Wednesday, July 22, 2009

Energy Market Commentary For Wednesday Evening

September crude oil closed down $0.36 at $65.25 a barrel today. Prices closed nearer the session high. Bulls still have the near term technical advantage. A two week old uptrend is in place on the daily bar chart.

September natural gas closed up 11.6 cents at $3.962 today. Prices closed nearer the session high and hit a fresh three week high today. Short covering in a bear market was featured. The bears are still in technical control.

September (RBOB) unleaded gasoline closed up 191 points at $1.8150 today. Prices closed nearer the session high today. A two week old uptrend is in place on the daily bar chart.

The September U.S. dollar index closed down 18 points at 78.91 today. Prices closed nearer the session low. Prices hit a fresh nine month low again today. Bears still have the overall near term technical advantage.

Complimentary Trend Analysis For Stock, Futures, And Forex
Stock & ETF Trading Signals