Showing posts with label Federal Reserve. Show all posts

Tuesday, April 5, 2022

Waiting For GLD To Make New Highs - Gold Rally Is Still Intact

The calm of the last 3 weeks has resulted in a risk on environment. This, in turn, has led to a nice recovery rally in stocks. For the time being, volatility has subsided. However, we believe there are many underlying market risks that can still resurface without any warning.

From late 2015 to August 2020, the price of gold doubled, going from approximately $1040 to $2080. Gold then experienced a profit taking $400 pullback. Gold’s rally over the past 12 months failed to break through its $2080 price level. After retreating back to $200, gold seems to have found support at the $1900 level.

In reviewing the following spot gold chart, it appears we have broken out of an accumulation phase and seem to be preparing to move above the $2080 high.....Continue Reading Here.

Tuesday, February 15, 2022

Stocks Fall as Gold and Oil Jumps Amid Tension Over Ukraine - FED

The FED has made it very clear that it will raise its benchmark interest rate, the federal funds rate. This could have severe consequences and even lead to a financial crisis. They are too far behind the curve and will be labeled a major policy error in the future, most likely. They have put themselves in a situation where they are now their own hostage. They need more leadership to describe what a soft landing is going to look like. They have been too slow to act, and now they are going too fast. The “Powell Put” has now been put out to pasture.

We believe that the FED will make more rate hikes than they have announced. Goldman Sachs thinks there will be four 25-basis-point increases in the federal funds rate in 2022. Jamie Dimon, CEO of JPMorgan Chase, said, “he wouldn’t be surprised if there were even more interest rate hikes than that in 2022. There’s a pretty good chance there will be more than four. There could be six or seven. I grew up in a world where Paul Volcker raised his rates 200 basis points on a Saturday night.”

Mr. James Bullard of the St. Louis FED spoke out in an arrogant tone that aggressive action is now required. The markets translated this to mean that the FED was going to call an emergency meeting as soon as this coming week to hike interest rates by no less than 50 basis points. This sent interest rates soaring and stock prices plummeting.....Read More Here


Saturday, January 29, 2022

Fed Comments Help To Settle Global Market Expectations

The recent Fed comments should have helped settle the global market expectations related to if and when the Fed will start raising rates and/or taking further steps to curb inflation trends. 

Additionally, the Fed has been telegraphing its intentions very clearly over the past few months, providing ample time for traders and investors to alter their approach to pending monetary tightening actions. Read the full Fed Statement here.

In my opinion, foreign markets are more likely to see increased risks and declining price trends for two reasons. 

First, at risk nations/borrowers struggle to reduce debt levels. 

Second, foreign market traders/investors struggle to adapt to the transition away from speculative “growth” trends. 

I think the U.S. Dollar may continue to show strength over the next 4+ months as the foreign traders pile into U.S. economic strength while the Fed initiates their tightening actions.

So it makes sense to me that global markets would recoil from Fed tightening while debt-heavy corporations/nations seek relief from rising debt obligations....Continue Reading Here.


Monday, December 24, 2018

The SP500 Breaks 2018 February Lows - What Next?

The ES (S&P e-mini contracts) broke the support level from the February 2018 lows immediately after the US Federal Reserve announced a 25 bp rate hike this week. This breakdown below the February 2018 lows is concerning because it indicates that previous support is not holding and we could be in for further downside price activity.


We are preparing a detailed research post for early next week regarding a broad range of US markets as well as how our proprietary price modeling systems are reflecting this recent price move. What we can suggest to all investors is play small positions at the moment and prepare for increased volatility. There is near term support that may come into play soon, but overall the markets are reacting to a deleveraging event that could see prices push below 2400 before finding true support.

Visit The Technical Traders to read all of our recent research posts and see what we believe will be the big movers in 2019.

Chris Vermeulen


Stock & ETF Trading Signals

Tuesday, August 7, 2018

Technical Analysis and Rates Unchanged – Here We Go

The U.S. Federal Reserve is one of the only central banks to attempt to raise rates consistently over the past few years, has possibly learned a very valuable lesson – no good comes from raising rates to the point of causing another market collapse. The news that the US Fed will leave interest rates where they are, temporarily, is good news for a number of reasons.

First, this allows the markets to shake out weaker players and weaker components of the corporate world. Where corporate debt levels are concerned, interest rates are tied to debt repayment liabilities and refinancing costs. Firms that are unable to manage at current interest rates certainly would not be happy about rising rates. This allows these corporations to either struggle to resolve their debt issues or collapse under the weight of their own debt. This will also play out in the foreign markets as well.

Second, it allows the housing market and private debt markets to shake out some of the “at risk” consumers. We authored an article a few months ago about how foreclosures and pre-foreclosures were starting to increase in nearly all markets. At the time, many people in the real estate field shrugged off these increases as par for the course. With the decreasing foreign investment in real estate and the increasing pressures on the local consumer markets, we saw a dramatic slowdown in housing starts and sales activities recently. This is because the demand side of the market is falling much faster than the supply capacity.

The uncertainty in the foreign markets, global central banks, and foreign investments have prompted many people to pull out of the local markets – even the hot markets. The at-risk consumers that were trying to sell near this top suddenly found the buyers were just not there or ready to make the commitment. This put the at-risk consumers in a difficult position as they could not flip their houses as easily as they could 6 months ago.

Yet, in the global equity markets, investors can sell or buy with much faster transaction times – at the click of a mouse button in most cases. This allows equity investors to pull capital away from risky investments and migrate that capital into more secure investments in a matter of minutes or hours – not weeks or months. And that is exactly what has been happening over the past 30+ days in the global markets.

Capital is repositioning for the next phase of this market; where the US economy is strong, housing continues to weaken and at-risk consumers continue to feel the pressures of the US Fed interest rate policies. Where foreign consumers attempt to deal with their own version of “central bank hell” and asset devaluations in an attempt to find more secure investment vehicles for their capital. Money market funds, investment funds and, of course, the US value/blue-chip equities are looking very promising right about now.

This Daily SPY chart shows our recent ADLC indicator (price cycle turning points) and our oversold extreme price levels shaded with lime green. When these two things align the market tends to rally for 1-3 days with strong momentum. During pre-market last week, we told our followers that the big gap lower in price was going to be bought and price should rally for 2-3 days, which is exactly what has unfolded thus far.


Global capital will continue to rush into the US markets as long as the US Fed does not do anything to derail things. Our research team believes the US Fed may even decrease the interest rates by 0.25% before the end of the year depending on how much pressure is placed on the economy by these “at risk” participants.

We will continue to keep you updated as to our findings and we want to urge you to visit The Technical Traders Free Market Research to read all of our most recent research posts. You really owe it to yourself to understand what is happening in the global markets right now and how we have continued to stay 30-60 days ahead of these moves for our valued members. There are so many opportunities setting up in the markets for traders it is almost hard to understand the dynamics at play right now. If you want a dedicated team of researchers and traders to help you navigate these markets, then visit The Technical Traders to learn how we can provide you with even more detailed daily research and support.

Chris Vermeulen


Stock & ETF Trading Signals

Tuesday, June 14, 2016

Precious Metals Take Center Stage....Let's Follow the Yellow Brick Road

By Jeff Thomas

For over a hundred years, it’s been theorised that author L. Frank Baum wrote his 1900 book, “The Wonderful Wizard of Oz”, as a fanciful way to explain the economic situation at the time and that the Yellow Brick Road was a reference to the path created by gold ownership. Whether or not the theory is correct, for many people today, “Follow the Yellow Brick Road” might serve as a mantra for alleviating economic woes.

What will happen is that one day, gold will suddenly be up $100 per ounce, then the next day, $200 per ounce. At first the pundits will be claiming that it’s an anomaly, but as it continues rising, a point will be reached when the average person says to himself, “This seems to be a trend. I’d better buy some gold.” 

Unfortunately, once the trend is underway, the price that day will have no bearing on whether gold is available. Your local coin shop may be sold out. If you go online, the mints may say that demand is exceeding supply. Large entities will be buying all they can get and the smaller buyers will be way down on the order list, unlikely to take delivery of even a single ounce.


These Are the Good Old Days

Gold has experienced a four year bear market and only recently has begun to rise again. But is it in reality a barbarous relic? Not by a long shot. For over 5,000 years, whenever people have experienced erratic economic periods, they’ve bought gold in order to stabilise their economic position. This has particularly been true whenever fiat currencies have been on the rise and were in danger of hyper-inflating, as in recent years. Most currencies are in decline against the U.S. dollar—a currency which, itself, is very much in danger of collapse in the not-too-distant future.

In the ’70s, I was buying gold in London, as it rose from $35. It reached a high of $850 in January, 1980, then crashed. When gold dropped below $400, I began buying Krugerrands. Sounds like a bargain, and yet, word on the street was that gold was headed further south. But I was buying long. I was not playing the market; I was building my economic insurance policy. I wasn’t too fussed over price fluctuations, as my gold holdings were meant to cover me if my other investments proved to be a mistake.

At present, gold is well above the high of 1989, but, if we adjust for inflation, we see that gold is actually a bargain at present. This excellent Casey Research chart from 2014 explains it better than mere words:


This tells us that $8,800 would not be an unreasonable level for gold today, if conditions were as dire as they were in 1980. However, conditions are far more dire—debt levels are far beyond any historical levels and markets are in a bubble, just waiting for the arrival of a pin.

A decade ago, when gold topped $700, I predicted $1,500 at some point and even my closest colleagues wondered what I’d been smoking. But it turned out that my prediction was, if anything, conservative. Over the last four years, some of the world’s most informed prognosticators—Eric Sprott, Peter Schiff, Jim Rickards, and Jim Sinclair—have all predicted gold to rise to between $5,000 and $7,000, and some have suggested numbers as high as $50,000. But this hasn’t happened. Are they wrong? No, it just hasn’t happened as of yet.

Conversely, Harry Dent has predicted a drop to $750. So, who’s right? Well, actually, they may all be right. After a crash in the markets, deflation is a certainty, as brokers and investors dump investments of every type in order to cover margin losses. This panic sell off will most assuredly include gold, even though the holders will not wish to sell their gold. This panic promises to create an immediate and possibly very dramatic downward spike in gold.

However, large numbers of long term investors already have their orders in for any price below $1,000. If the spike drops below that number, it will therefore be brief, as every ounce that hits the market at $999 is scooped up. In addition, the Federal Reserve will make good on its decades-long promise to roll the printing presses to counter any sudden deflation. That very act will light the fuse on the gold rocket and send it skyward.

Will the Sun Rise in the Morning or Set in the Evening?

The argument over whether gold will drop to $750 or rise to $5,000 is a pointless one. Any understanding of basic economics assures us that we shall see both sudden deflation and dramatic inflation. It’s as natural and inevitable as sunrise and sunset. (By the way, several of the above individuals have standing bets with each other as to the $750 number. The prize? An ounce of gold.)

But it matters little who will win the bets. What matters is the overview. Rickety economic times are now upon us and they will soon morph into crisis times. In such times, precious metals always return to centre stage, as paper currencies and electronic currencies return to their intrinsic worth of zero. Gold does not so much rise against fiat currencies, as fiat currencies collapse against gold.

Most assuredly, we shall see a dramatic rise in gold, but, just as in the ‘70s, the average person will fail to understand why and will simply chase the upward trend. When gold hits $2,000, but no one is willing to sell for under, say, $2,500, those who are chasing the trend will pay the $2,500 and that will become the new price across the board. Then it will leap higher—again and again, as monetary panic grips the investment world. The inflation-adjusted 1980 price of $8,800 should not be a surprise at all—in fact it would be low, as, in the coming years, conditions will be far more dire than in 1980. Gold may well blow through $10,000. Even the $50,000 figure is not impossible, as we shall be seeing a runaway bull market where those chasing the trend carry gold beyond any rational value.

But gold has an intrinsic value. 2,000 years ago, an ounce of gold could buy you a good suit of clothes. That’s still true today. A gold mania will fuel the gold price beyond anything logical, but a correction will be equally inevitable, dropping it to its intrinsic value. We shall see a gold rise for the record books. The wise investor should already have stocked up his supply of physical gold and gotten rid of gold ETFs. He should already have his seat belt fastened and ready for take off. We’re off to see the wizard.

Editor’s Note: Owning gold is the first step to protecting your wealth from stock market crashes, currency collapses or destructive government policies. But there are many other steps you can take to protect yourself during an economic collapse. We put together a free video to show you exactly how. 

Click here to watch this video now.


The article Follow the Yellow Brick Road was originally published at caseyresearch.com.


Get out latest FREE eBooK "Understanding Options"....Just Click Here

Stock & ETF Trading Signals

Sunday, December 20, 2015

Is the “Easy Money Era” Over?

By Justin Spittler

It finally happened. Yesterday, the Federal Reserve raised its key interest rate for the first time in nearly a decade. Dispatch readers know the Fed dropped interest rates to effectively zero during the 2008 financial crisis. It has held rates at effectively zero ever since…an unprecedented policy that has warped the financial markets. Rock bottom interest rates make it extremely cheap to borrow money. Over the last seven years, Americans have borrowed trillions of dollars to buy cars, stocks, houses, and commercial property. This has pushed many prices to all time highs. U.S. stock prices, for example, have tripled since 2009.

The Fed raised its key rate by 0.25%.....

U.S. stocks rallied on the news, surprising many investors. The S&P 500 and NASDAQ both gained 1.5% yesterday. The Fed plans to continue raising rates next year. It’s targeting a rate of 1.38% by the end of 2016. So, is this the beginning of the end of the “easy money era?” For historical perspective, here’s a chart showing the Fed’s key rate going back to 1995. As you can see, yesterday’s rate hike was tiny. The key rate is still far below its long term average of 5.0%.


Josh Brown, writer of the financial website The Reformed Broker, put the Fed’s rate hike in perspective.

The overnight borrowing rate…has now risen from “around zero” to “basically zero.”

In other words, interest rates are still extremely low, and borrowing is still extremely cheap. We’re not ready to call the end of easy money yet.

Cheap money has goosed the commercial property market..…

Commercial property prices have surged 93% since bottoming in 2009. Prices are now 16% higher than their 2007 peak, according to research firm Real Capital Analytics. Borrowed money has been fueling this hot market. According to the Fed, the value of commercial property loans held by banks is now $1.76 trillion, an all time high. The apartment market is especially frothy today. Apartment prices have more than doubled since November 2009. U.S. apartment prices are now 34% above their 2007 peak.

Sam Zell is cashing out of commercial property..…

Zell is a real estate mogul and self-made billionaire. He made a fortune buying property for pennies on the dollar during recessions in the 1970s and 1990s. It pays to watch what Zell is buying and selling. He was one of few real estate gurus to spot the last property bubble and get out before it popped. In February 2007, Zell sold $23 billion worth of office properties. Nine months later, U.S. commercial property prices peaked and went on to plunge 42%.

Recently, Zell has started selling again. In October, Zell’s company sold 23,000 apartment units, about one quarter of its portfolio. The deal was valued at $5.4 billion, making it one of the largest property deals since the financial crisis. The company plans to sell 4,700 more units in 2016. Yesterday, Zell told Bloomberg Business that “it is very hard not to be a seller” with the “pricing currently available in the commercial real estate market.”

Recent stats from the commercial property market have been ugly. In the third quarter, commercial property transactions fell 6.5% from a year ago. Transaction volume also fell 24% between the second quarter and third quarter.

Auction.com, the largest online real estate marketplace, said economic growth is hurting the market.
Both commercial real estate transaction volume and pricing have showed signs of softening over the past few months. It’s likely that what we’re seeing is the result of reduced capital spending due to some weakness in the U.S. economy, coupled with a highly volatile economic climate in China and ongoing financial issues in Europe.

Zell is bearish on the U.S. economy..…

On Bloomberg yesterday, he predicted that the U.S. will have a recession by the end of 2016.
I think that there’s a high probability that we’re looking at a recession in the next twelve months.

A recession is when a country’s economy shrinks two quarters in a row. The U.S. economy hasn’t had a recession in six years. Instead, it’s been limping through its weakest recovery since World War II.
Zell continued to say that the U.S. economy faces many challenges.

World trade is slowing. Currencies continue to be manipulated. You’re looking at the beginnings of layoffs in multinational companies. We’re still looking all over the world for demand…
So, when you look at those factors it’s hard to see where strength is going to come from. I think weakness is going to be pervasive.

Like Zell, we see tough economic times ahead. To prepare, we suggest you hold a significant amount of cash and physical gold. We put together a short video presentation with other strategies for how to protect your money in an economic downturn. Click here to watch.

Chart of the Day

The U.S. economy is in an “industrial recession”. In recent editions of the Dispatch, we’ve told you that major American manufacturers are struggling to make money. For example, sales for global machinery maker Caterpillar (CAT) have declined 35 months in a row. In October, CAT’s global sales dropped by 16%...its worst sales decline since February 2010.

Today’s chart shows the yearly growth in U.S. industrial production. The bars on the chart below indicate recessions. Last month, U.S. industrial production declined -1.17% from the prior year. It marked the 19th time since 1920 that industrial output dropped from a positive reading to a reading of -1.1% or worse.
15 of the last 18 times this happened – or 83% of the time – the U.S. economy went into recession.


The article Is the “Easy Money Era” Over? was originally published at caseyresearch.com.


Get our latest FREE eBook "Understanding Options"....Just Click Here!

Tuesday, December 8, 2015

Janet Yellen: The Best Pick Pocket in the USA

By Tony Sagami

“Some of the experiences [in Europe] suggest maybe we can use negative interest rates.”
—William Dudley, President of the New York Federal Reserve Bank

“We see now in the past few years that it [negative interest rates] has been made to work in some European countries. So I would think that in a future episode that the Fed would consider it.”
Ben Bernanke

“Indeed, I would be open to the possibility of reducing the fed funds target funds range even further, as a way of producing better labor market outcomes.”
—Narayana Kocherlakota, President of the Minneapolis Federal Reserve Bank

If you are planning to travel to any major European city, you better watch your wallet because there are thousands of very skilled pickpockets looking to separate you from your valuables. Those pickpockets, however, will only get away with however much money you have in your wallet. Sure, a pickpocket can throw a major monkey wrench into your vacation, but the amount these European thieves take from you is peanuts compared to what Fed head Janet Yellen wants to steal from your bank account.

While Wall Street experts and CNBC talking heads regularly debate the "will they or wont they" interest rate liftoff, a more important question is whether or not the Federal Reserve will follow the European model of negative interest rates. Negative interest rates are nothing unusual in Europe as several central banks lowered key interest rates below 0%.


Yup, that means investors essentially pay a fee to park their money.

That parking fee just got higher last week when the European Central Bank cut its already negative deposit rate from minus 0.2% to minus 0.3%. The ECB also expanded is current quantitative easing program. The European Central Bank, the Swiss National Bank, and the Danish National Bank all have interest rates below zero. In fact, the Danes have held their overnight rates at negative 0.75% since 2012.

The Swiss, however, are the undisputed leaders of the negative interest rate experiment. The SNB first moved to negative rates in December 2014 and then dropped rates to negative 0.75% in January of this year. The Swiss National Bank, by the way, meets in a couple of days, on December 10, and is widely expected to cut rates again.

The question, of course, is how negative can interest rates go? Before the end of December, I expect deposit rates in Switzerland to be between -100bps and -125bps. Remember, we’re not talking about some backwater, third world countries here. Switzerland and Germany are two of the wealthiest countries in the world, as well as the home of major financial and political centers.

And I’m not just talking about short term paper either. Finland, Germany, France, Switzerland, and Japan are all selling five year debt with negative yields. In fact, Switzerland became the first country in history to sell benchmark 10 year debt at a negative interest rate in April.

Don’t think that negative interest rates can happen in the US? Wrong!

You may have missed it, but the United States is now also a member of the “0% club”—most recently in October, when it sold $21 billion worth of 3 month bills at 0% interest.


However, that is not the first time. Since 2008, the US government has held 46 Treasury bill auctions where yields have been zero. The next step after zero is negative… and it’s becoming a real possibility. Welcome to the European model of starving savers to death!

The implications for investors are monumental.

Ask yourself, what would you do with your money if your bank started to charge you to deposit it there? Would you pay hundreds, perhaps thousands of dollars a year just to keep your money in a bank?

Option #1: Hold your nose and pay the fees.
Option #2: Move those dollars into the stock market; perhaps into dividend paying stocks.
Option #3: Buy real estate; perhaps income generating real estate.
Option #4: Invest in collectibles, like art or classic cars.
Option #5: Stuff your money under a mattress.


The point I am trying to make is, the rules for successful income investing have completely changed. If you are living (or plan on living) off the earnings of your savings, you better adapt your strategy to the new world of negative interest rates…..or plan on working as a Walmart greeter during your golden years.


Even if you think I’m nuts about negative interest rates coming to the US, there is no doubt that interest rates are not climbing anytime soon.

According to the Federal Reserve.....
"The Committee anticipates that inflation will remain quite low in the coming months.”
“The stance of monetary policy will likely remain highly accommodative for quite some time after the initial increase in the federal funds rate.”

With the US national debt approaching $19 trillion, our government doesn’t have any choice but to keep interest rates low. Sadly, our politicians are paying for their spendthrift ways by starving responsible savers.
But you can (and should) fight back by changing the way you think about investing for income. You can start by giving my high yield income letter, Yield Shark, a risk free try with 90 day money back guarantee.

Tony Sagami
Tony Sagami

30 year market expert Tony Sagami leads the Yield Shark and Rational Bear advisories at Mauldin Economics. To learn more about Yield Shark and how it helps you maximize dividend income, click here.

To learn more about Rational Bear and how you can use it to benefit from falling stocks and sectors, click here.


Get our latest FREE eBook "Understanding Options"....Just Click Here!

Wednesday, November 18, 2015

The World's First Cashless Society Is Here - A Totalitarian's Dream Come True

By Nick Giambruno

Central planners around the world are waging a War on Cash. In just the last few years:
  • Italy made cash transactions over €1,000 illegal;
  • Switzerland proposed banning cash payments in excess of 100,000 francs;
  • Russia banned cash transactions over $10,000;
  • Spain banned cash transactions over €2,500;
  • Mexico made cash payments of more than 200,000 pesos illegal;
  • Uruguay banned cash transactions over $5,000; and
  • France made cash transactions over €1,000 illegal, down from the previous limit of €3,000.
The War on Cash is a favorite pet project of the economic central planners. They want to eliminate hand-to-hand currency so that governments can document, control, and tax everything. This is why they’re lowering the threshold for mandatory reporting of cash transactions and, in some instances, simply making it illegal to pay cash.

In the U.S., central planners ratchet up the War on Cash every time the government declares a made-up war on something else…a war on crime, a war on drugs, a war on poverty, a war on terror…..

They all end with more government intrusion into your financial affairs. Thanks to these made-up wars, the U.S. government is imposing an increasing number of regulations on cash transactions. Try withdrawing more than $10,000 in cash from your bank. They’ll treat you like a criminal or terrorist. The Federal Reserve is at the center of the War on Cash. Its weapons are inflation and control over the currency denominations.

Take the $100 note, for example. It’s the largest bill in circulation today. This was not always the case. At one point, the U.S. had $500, $1,000, $5,000, and even $10,000 notes. But the government eliminated these large notes in 1969 under the pretext of fighting the War on Some Drugs. Since then, the $100 note has been the largest. But it has far less purchasing power than it did in 1969. Decades of rampant money printing have inflated the dollar. Today, a $100 note buys less than a $20 note did in 1969.

Even though the Federal Reserve has devalued the dollar over 80% since 1969, it still refuses to issue notes larger than $100. This makes it inconvenient to use cash for large transactions, which forces people to use electronic payment methods. This, of course, is what the U.S. government wants. It’s exactly like Ron Paul said: “The cashless society is the IRS’s dream: total knowledge of, and control over, the finances of every single American.”

Policymakers or Central Planners?

On stories related to the War on Cash, you may have noticed that the mainstream media often uses the word “policymakers,” as in “policymakers have decided to keep interest rates at record low levels.” When the media uses “policymakers,” they are often referring to central bank officials. It’s a curious word choice. As far as I can tell, there is no difference between a policymaker and central planner. Most people who want to live in a free society agree that central planning is not a good idea. So the media uses a different word to put a more neutral spin on things.

To help you think more clearly, I suggest substituting “central planners” every time you see “policymakers.”

The World’s First Cashless Society

In 1661, Sweden became the first country in Europe to issue paper money. Now it’s probably going to be the first in the world to eliminate it. Sweden has already phased out most cash transactions. According to Credit Suisse, 80% of all purchases in Sweden are electronic and don’t involve cash. And that figure is rising. If the trend continues - and there is nothing to suggest it won’t - Sweden could soon be the world’s first cashless society.

Sweden’s supply of physical currency has dropped over 50% in the last six years. A couple of major Swedish banks no longer carry cash. Virtually all Swedes pay for candy bars and coffee electronically. Even homeless street vendors use mobile card readers. Plus, an increasing number of government restrictions are encouraging Swedes to dump cash. The pretexts are familiar…fighting terrorism, money laundering, etc. In effect, these restrictions make it inconvenient to use cash, so people don’t.

So far, Swedes have passively accepted the government and banks’ drive to eliminate cash. The push to destroy their financial privacy doesn’t seem to bother them. This is likely because the average Swede places an unreasonable amount of trust in government and financial institutions. Their trust is certainly misplaced. On top of the obvious privacy concerns, eliminating cash enables the central planners’ latest gimmick to goose the economy: Negative interest rates.

Making The Negative Interest Rate Scam Possible

Sweden, Denmark, and Switzerland all have negative interest rates. Negative interest rates mean the lender literally pays the borrower for the privilege of lending him money. It’s a bizarre, upside down concept. But negative rates are not some European anomaly. The Federal Reserve discussed the possibility of using negative interest rates in the U.S. at its last meeting. Negative rates could not exist in a free market. They destroy the impetus to save and build capital, which is the basis of prosperity.

When you deposit money in a bank, you are lending money to the bank. However, with negative rates you don’t earn interest. Instead, you pay the bank. If you don’t like that plan, you can certainly stash your cash under the mattress. As a practical matter, this limits how far governments and central banks can go with negative interest rates. The more it costs to store money at the bank, the less inclined people are to do it.

Of course, central planners don’t want you to withdraw money from the bank. This is a big reason why they want to eliminate cash…so you can’t. As long as your money stays in the bank, it’s vulnerable to the sting of negative interest rates and also helps to prop up the unsound fractional reserve banking system. If you can’t withdraw your money as cash, you have two choices: You can deal with negative interest rates...or you can spend your money.

Ultimately, that’s what our Keynesian central planners want. They are using negative interest rates and the War on Cash to force you to spend and “stimulate” the economy. If you ask me, these radical and insane measures are a sign of desperation. The War on Cash and negative interest rates are huge threats to your financial security. Central planners are playing with fire and inviting a currency catastrophe.

Most people have no idea what really happens when a currency collapses, let alone how to prepare. How will you protect your savings in the event of a currency crisis? This just-released video will show you exactly how. Click here to watch it now.

The article was originally published at internationalman.com.


Get our latest FREE eBook "Understanding Options"....Just Click Here!

Thursday, October 22, 2015

The Government’s Fun with (Inflation) Numbers

By Tony Sagami


My normally super sweet baby sister barked at me like an angry dog when I told her that there simply isn’t any inflation in the US. “You need to go to the grocery store with me. You are completely out of touch with reality,” she snapped.   Geez. Excuse me!

My sister, however, should know. She has two boys—one teenager and one college student that still lives at home—with big appetites, so she spends a lot of time and money at her local grocery store.

The topic came up because of the latest Producer Price Index (PPI) numbers from the Labor Department, which said that prices at the wholesale level actually declined by 0.5% in September. Over the last 12 months through September, the PPI has dropped by 1.1%... that’s the eighth consecutive 12-month decrease in the index.


Even if you exclude food and energy—the so-called core prices were down 0.3% in September.
Is my sister crazy? That depends on whether you believe the government’s heavily massaged numbers or people like my sister and farmers. Here’s what I mean. While the Labor Department was spitting out its PPI numbers, the Wisconsin Farm Bureau Federation (WFBF) begged to differ.


The Wisconsin Farm Bureau Federation tracks the prices of key agricultural commodities that most American households use every day. Sure, the price of a gallon of milk may be slightly different in Texas than in Wisconsin… but not by that much, and the price trends are usually very similar.

Well, according to the WFBF, the prices of basic grocery staples are rising.


The bureau tracks the cost of 16 widely used food items to come up with its Marketbasket index. The newest semi annual survey of the 16 items rose to $53.37, up $1.41 or 2.7% compared with one year ago.
Nine of the 16 items surveyed increased in price while six decreased in price compared with WFBF’s 2015 spring survey. One item, apples, was unchanged.


“The survey’s meat items are the heaviest price pullers. As high-value items, they influence our survey’s overall price even if they only change slightly,” said Casey Langan of the WFBF. So my baby sister was right!

Moreover, the WFBF doesn’t have an ax to grind when it comes to inflation. It is simply reporting the prices of a static basket of commonly used food items. I don’t bring this up to prove how smart my sister is. Heck, any housewife in America could have told you the same thing. Moreover, my sister also complained about big price increases for pharmaceutical drugs, college tuition, and services like dry cleaning and automotive repair.

My points are that (a) you should always look at government produced numbers with a skeptical eye, and (b) understand that the government, particularly the Federal Reserve, uses these heavily massaged numbers to justify its agenda. For example, the lower the cost of living, the less the US government has to pay out in cost of living adjustments for Social Security and federal pension recipients.

And when it comes to interest rates, the Federal Reserve has proven that it doesn’t want to raise interest rates—and it will happily use the latest PPI numbers to prove its point that inflation isn’t a problem.
Fed officials have said they want to be “reasonably confident” inflation will move toward their 2% target before they raise interest rates. The latest PPI numbers will keep rates at zero for at least the rest of 2015 and well into 2016.

Daniel Tarullo, a member of the Fed’s Board of Governors, said last week that the Federal Reserve should not increase interest rates this year. “Right now my expectation is—given where I think the economy would go—I wouldn’t expect it would be appropriate to raise rates.”

Fellow Fed Governor Lael Brainard echoed that view and made the case for more patience last Monday.
Bottom line: You should absolutely believe the Fed when it says that it will “remain highly accommodative for quite some time.”

If you’re an income-focused investor, that conclusion has gigantic implications for how you should invest your money, and if you’re keeping your money in short term CDs, T-bills, and money funds in anticipation of higher rates….. you are making a big mistake.

Try my monthly newsletter, Yield Shark, for stock recommendations with high yield and great potential upside—with a 90 day money back guarantee.
Tony Sagami
Tony Sagami

30 year market expert Tony Sagami leads the Yield Shark and Rational Bear advisories at Mauldin Economics. To learn more about Yield Shark and how it helps you maximize dividend income, click here.

To learn more about Rational Bear and how you can use it to benefit from falling stocks and sectors, click here.


Get our latest FREE eBook "Understanding Options"....Just Click Here!

Tuesday, October 6, 2015

Recession Watch

By John Mauldin 

“Growth is never by mere chance; it is the result of forces working together.”– J.C. Penney

“Strength and growth come only through continuous effort and struggle.”– Napoleon Hill

“We’re lost, but we’re making good time.”– Yogi Berra

The Yogi Berra quote above, which was brought to my attention this week, seems an apt description of where the markets and the economy are today. Nobody is quite sure where we are or where we’re going, but we all seem to think we’re going to get there soon.

I think it’s pretty much a given that we’re in for a cyclical bear market in the coming quarters. The question is, will it be 1998 or 2001/2007? Will the recovery look V shaped, or will it drag out? Remember, there is always a recovery. But at the same time, there is always a recession out in front of us; and that fact of life is what makes for long and difficult recoveries, not to mention very deep bear markets.

The problem is that our most reliable indicator for a recession is no longer available to us. The Federal Reserve did a study, which has been replicated. They looked at 26 indicators with regard to their reliability in predicting a recession. There was only one that was accurate all the time, and that was an inverted yield curve of a particular length and depth. Interestingly, it worked almost a year in advance. The inverted yield curve indicator worked very well the last two recessions; but now, with the Federal Reserve holding interest rates at the zero bound, it is simply impossible to get a negative yield curve.

Understand, an inverted yield curve does not cause a recession. It is simply an indicator that an economy is under stress. So now we are in an environment where we can look only at “predictive” indicators that are not 100% reliable. Actually, most are not even close. Some indicators have predicted seven out of the last four recessions. Some never trigger at all.

Recession Watch
All that said, looking at data from the last few weeks suggests that we need to be on “recession watch.” Global GDP is clearly slowing down, and the data we are getting from the US suggests that we are going to see a serious falloff in GDP over the next few quarters. I want to look at the recent (very disappointing) employment numbers, earnings forecasts (and some funny accounting), credit spreads, total leverage in the system, and the overall environment where credit, which has been the fuel for growth, is under pressure. The totality of this data says that we have to be on alert for a recession, because a recession will mean a full-blown bear market (down at least 40%), rising unemployment, and (sadly) QE4.

The jobs report on Friday was just ugly. Private payrolls increased by just 118,000, which is about the minimum level needed for unemployment not to rise. Government payrolls added 24,000. There were serious downward revisions to the last two months, as well. August was taken down by 37,000 jobs, and July was reduced by 22,000. The last three months have averaged just 167,000 new jobs compared to 231,000 for the previous three months and 260,000 for the six months prior to that.

My friend David Rosenberg dug a little deeper into the numbers and noted: Adding insult to injury and revealing an even softer underbelly to this report was the contraction in the workweek to 34.5 hours from 34.6 hours in August, which is effectively equivalent to an added 348,000 job losses.

So take the headline number, tack on the downward revisions and the loss of labour input from the decline in the workweek, and the "real" payroll number was [a minus] 265,000. You read that right.

He added: “Have no doubt that if the contours of the job market continue on this recent surprising downward path… [m]arket chatter of QE four by March 2016 is going to be making the rounds.”
While the unemployment rate remained at 5.1%, it did so largely because of a significant drop in the labor participation rate, which is not a good way to enhance employment. Further, the U-6 unemployment number is still a rather depressing 10%. Those are the people who are working part-time but would like full time jobs, as well as discouraged and marginally attached workers. Very few part-time jobs pay enough to finance a middle class lifestyle.

Earnings Recession
Leo Kolivakis of Pension Pulse has a downbeat earnings season preview, aptly titled “A Looming Catastrophe Ahead?

Analysts have been steadily cutting 3Q earnings projections, and those revisions threaten to make some richly priced stocks even more so. Thomson Reuters data shows analysts expect a 3.9% year over year decline in S&P 500 earnings. Expectations are falling for future quarters as well.

These expectations have some strategists talking about an “earnings recession.” Just as an economic recession is two consecutive quarters of falling GDP, an earnings recession is two consecutive quarters of falling corporate profits.

The headwinds are no mystery. China’s weaker import demand is hurting all kinds of companies, especially raw materials and infrastructure suppliers. Caterpillar (CAT) slashed its revenue forecast and announced 10,000 job cuts. That probably isn’t playing well in Peoria. Accompanying the falloff in Chinese demand is an increase in the number of containers coming into the US as the strong dollar allows us to buy more and sell less. Not a particularly useful combination.

I love this quote from a Reuters story: “How can we drive the market higher when all of these signals aren’t showing a lot of prosperity?” said Daniel Morgan, senior portfolio manager at Synovus Trust Company in Atlanta, Georgia, who cited earnings growth as one of the drivers of the market. As we all know, it is every portfolio manager’s job to “drive the market higher.” Daniel evidently wants to do his part.

Sadly, despite our best efforts, the stock market faces an uphill climb. More from Reuters: Even with the recent selloff, stocks are still expensive by some gauges. The S&P 500 Index is selling at roughly 16 times its expected earnings for the next 12 months, lower than this year's peak of 17.8 but higher than the historic mean of about 15. The index would have to drop to about 1,800 to bring valuations back to the long-term range. The S&P 500 closed at 1,931.34 on Friday [Sept 25].

Moreover, forward and trailing price-to-earnings ratios for the S&P 500 are converging, another sign of collapsing growth expectations. The trailing P/E stands at about 16.5, Thomson Reuters data shows. Last year at this time, the forward P/E was also 16 but the trailing was 17.6.

The last period of convergence was in 2009 when earnings were declining following the financial crisis. The Energy sector is the biggest drag on earnings, meaning that we now see analysts everywhere calculating estimates “ex energy.” I suppose this produces useful information, but if we are going to exclude the bottom outlier, shouldn’t we exclude the top outlier as well? Healthcare is carrying much of the earnings burden for S&P 500 stocks, but I have yet to see an ex healthcare or ex energy & healthcare estimate. A funny thing about earnings: they’ve been going up for the past year, even as top line revenue has not. Generally, those go hand in hand. What’s happening?

And for the answer I have a story. A few years ago I made an assumption as to how a new stream of income would be taxed. I made that assumption based on my knowledge of having had similar income in the ’80s and ’90s. It turned out the rules had changed, and I hit the end of the year owing what was for me a rather large sum, as I was also trying to finance and build my new apartment.

I told my tale of woe to my accountant, Darrell Cain, who obviously detected the distress in my voice. He smiled at me and said, “John, I have an elephant bullet.” He reached under the table and pulled out an imaginary elephant bullet. “This is a big bullet. But I only have one of them. Once you use this bullet you can never use it again. If another elephant comes down the road, there will be nothing you can do.”

And yes, there were some one time tax maneuvers that reduced my taxes to a manageable number. But as he said, those were a one time option.

There is no way to prove it, but I think corporate accountants have been using up their elephant bullets this past year, as corporations want to be able to maintain the fiction that earnings are rising, so that price to earnings ratios don’t come under stress and cause stock prices to fall. You can move expenses from quarter to quarter, put off certain spending, recharacterize certain expenses one time, and so on. I deeply suspect we are going to find that some recent corporate earnings have been of the smoke and mirrors type.

Further, as I’ve written in previous letters, earnings forecasts are notoriously trend-following and typically miss the turns. If earnings are beginning to fall – and it appears they are – it is highly likely that earnings estimates will miss to the downside. If we slide into a recession at the same time, they will miss to the downside rather dramatically.

Is GDP Flatlining?
The Commerce Department will release its first estimate for 3Q US GDP on Thursday, Oct. 29. By then we will be in the thick of earnings season and will already know how many companies performed.

In the big picture, income (corporate or individual) can’t grow unless the economy grows. GDP may be a flawed way to measure economic growth, but it is the best tool we have. Blue chip estimates right now are that it ran at near a 2.5% annualized growth rate last quarter. However, the Atlanta Fed has sharply revised their GDP estimate for the third quarter down to under 1%. (See chart below.)

Will economic growth come into harmony with income growth? We know they have to meet eventually. At present, it appears GDP will stay in slow growth mode. That means it probably won’t be able to pull earnings up with it.


High-Yield – Rising Defaults
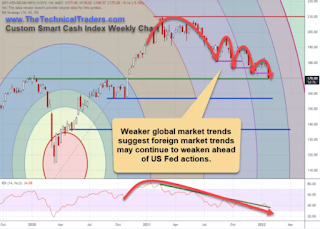
High yield spreads have been tightening and interest rates have been rising for some time. This is starting to cause some distress in the high yield (otherwise known as junk bond) market. My friend Steve Blumenthal has been following and timing the high yield market for 20 years. He recently wrote the following, which I’m going to blatantly cut and paste as it clearly depicts the level of distress in the high yield market.

If credit becomes more difficult to get, then growth is going to come under stress as well. I note that corporations that I think of as issuing higher quality debt are paying 10%. Thank you very much. Ten percent interest rates don’t seem to me to be very low.

To continue reading this article from Thoughts from the Frontline – a free weekly publication by John Mauldin, renowned financial expert, best selling author, and Chairman of Mauldin Economics – please click here.

The article Thoughts from the Frontline: Recession Watch was originally published at mauldineconomics.com.


Get our latest FREE eBook "Understanding Options"....Just Click Here!

Friday, October 2, 2015

A Worrying Set Of Signals

By John Mauldin 

There is presently a bull market in complacency. There are very few alarm bells going off anywhere; and frankly, in reaction to my own personal complacency, I have my antenna up for whatever it is I might be missing that would indicate an approaching recession.

It was very easy to call the last two recessions well in advance because we had inverted yield curves. In the US at least, that phenomenon has a perfect track record of predicting recessions. The problem now is that, with the Federal Reserve holding the short end of the curve at the zero bound, there is no way we can get an inverted yield curve, come hell or high water. For the record, inverted yield curves do not cause recessions, they simply indicate that something is seriously out of whack with the economy. Typically, a recession shows up three to four quarters later.

I know from my correspondence and conversations that I am not the only one who is concerned with the general complacency in the markets. But then, we’ve had this “bull market in complacency” for two years and things have generally improved, albeit at a slower pace in the current quarter.

With that background in mind, the generally bullish team at GaveKal has published two short essays with a rather negative, if not ominous, tone. Given that we are entering the month of October, known for market turbulence, I thought I would make these essays this week’s Outside the Box. One is from Pierre Gave, and the other is from Charles Gave. It is not terribly surprising to me that Charles can get bearish, but Pierre is usually a rather optimistic person, as is the rest of the team.

I was in Toronto for two back-to-back speeches before rushing back home this morning. I hope you’re having a great week. So now, remove sharp objects from your vicinity and peruse this week’s Outside the Box.

Your enjoying the cooler weather analyst,
John Mauldin

Stay Ahead of the Latest Tech News and Investing Trends...

Each day, you get the three tech news stories with the biggest potential impact.

A Worrying Set Of Signals

By Pierre Gave
Regular readers will know that we keep a battery of indicators to gauge, among other things, economic activity, inflationary pressure, risk appetite and asset valuations. Most of the time this dashboard offers mixed messages, which is not hugely helpful to the investment process. Yet from time to time, the data pack points unambiguously in a single direction and experience tells us that such confluences are worth watching. We are today at such a point, and the worry is that each indicator is flashing red.

Growth: The three main indices of global growth have fallen into negative territory: (i) the Q-indicator (a diffusion index of leading indicators), (ii) our diffusion index of OECD leading indicators, and (iii) our index of economically-sensitive market prices. Also Charles’s US recession indicator is sitting right on a key threshold (see charts for all these indicators in the web version).

Inflation: Our main P-indicator is at a maximum negative with the diffusion index of US CPI components seemingly in the process of rolling over; this puts it in negative territory for the first time this year.

Risk appetite: The Gavekal velocity indicator is negative which is not surprising given weak market sentiment in recent weeks. What worries us more is the widening of interest rate spreads—at the long end of the curve, the spread between US corporate bonds rated Baa and treasuries is at its widest since 2009; at the short-end, the TED spread is back at levels seen at the height of the eurozone crisis in 2012, while the Libor-OIS spread is at a post-2008 high. Moreover, all momentum indicators for the main equity markets are at maximum negative, which has not been seen since the 2013 “taper tantrum”.

These weak readings are especially concerning, as in recent years, it has been the second half of the year when both the market and growth has picked up. We see three main explanations for these ill tidings:

1) Bottoming out: If our indicators are all near a maximum negative, surely the bottom must be in view? The contrarian in us wants to believe that a sentiment shift is around the corner. After all, most risk-assets are oversold and markets would be cheered by confirmation that the US economy remains on track, China is not hitting the wall and the renminbi devaluation was a one-off move. If this occurs, then a strong counter-trend rally should ramp up in time for Christmas.

2) Traditional indicators becoming irrelevant: Perhaps we should no longer pay much attention to fundamental indicators. After all, most are geared towards an industrial economy rather than the modern service sector, which has become the main growth driver. In the US, industrial production represents less than 10% of output, while in China, the investment slowdown is structural in nature. The funny thing is that employment numbers everywhere seem to be coming in better than expected. In this view of things, either major economies are experiencing a huge drop in labor productivity, or our indicators need a major refresh (see Long Live US Productivity!).

3) Central banks out of ammunition: The most worrying explanation for the simultaneous decline in our indicators is that air is gushing out of the monetary balloon. After more than six years of near zero interest rates, asset prices have seen huge rises, but investment in productive assets remains scarce.

Instead, leverage has run up across the globe. According to the Bank for International Settlements’ recently released quarterly review, developed economies have seen total debt (state and private) rise to 265% of GDP, compared to 229% in 2007. In emerging economies, that ratio is 167% of GDP, compared to 117% in 2007 (over the period China’s debt has risen from 153 to 235% of GDP). The problem with such big debt piles is that it is hard to raise interest rates without derailing growth.

Perhaps it is not surprising that in recent weeks the Federal Reserve has backed away from hiking rates, the European Central Bank has recommitted itself to easing and central banks in both Norway and Taiwan made surprise rate cuts. But if rates cannot be raised after six-years of rising asset prices and normalizing growth, when is a good time? And if central banks are prevented from reloading their ammunition, what will they deploy the next time the world economy hits the skids?

Hence we have two benign interpretations and one depressing one. Being optimists at heart, we want to believe that a combination of the first two options will play out. If so, then investors should be positioned for a counter-trend rally, at least in the short-term. Yet we are unsettled by the market’s muted response to the Fed’s dovish message. That would indicate that investors are leaning towards the third option. Hence, we prefer to stay protected and for now are not making a bold grab for falling knifes. At the very least, we seek more confirmation on the direction of travel.

Positioning For A US Recession

By Charles Gave
Since the end of last year I have been worried about an “unexpected” slowdown, or even recession, in the world’s developed economies (see Towards An OECD Recession In 2015). In order to monitor the situation on a daily basis, I built a new indicator of US economic activity which contains 17 components ranging from lumber prices and high-yield bond spreads to the inventory-to-sales ratio. It was necessary to construct such an indicator because six years of extreme monetary policy in the US (and other developed markets) has stripped “traditional” cyclical economic data of any real meaning (see Gauging The Chances Of A US Recession).

Understanding this diffusion index is straightforward. When the reading is positive, investors have little to worry about and should treat “dips” as a buying opportunity. When the reading is negative a US recession is a possibility. Should the reading fall below – 5 then it is time to get worried – on each occasion since 1981 that the indicator recorded such a level a US recession followed in fairly short order. At this point, my advice would generally be to buy the defensive team with a focus on long dated US bonds as a hedge. This is certainly not a time to buy equities on dips.

Today my indicator reads – 5 which points to a contraction in the US, and more generally the OECD. Such an outcome contrasts sharply with official US GDP data, which remains fairly strong. Pierre explored this discrepancy in yesterday’s Daily (see A Worrying Set Of Signals), so my point today is to offer specific portfolio construction advice in the event of a developed market contraction. My assumption in this note is simply that the US economy continues to slow. Hence, the aim is to outline an “anti-fragile” portfolio which will resist whatever brickbats are hurled at it.

During periods when the US economy has slowed, especially if it was “unexpected” by official economists, then equities have usually taken a beating while bonds have done well. For this reason, the chart below shows the S&P 500 divided by the price of a 30 year zero coupon treasury.

A few results are immediately clear:
  • Equities should be owned when the indicator is positive.
     
  • Bonds should be held when the indicator is negative.
     
  • The ratio of equities to bonds (blue line) has since 1981 bottomed at about 50 on at least six occasions. Hence, even in periods when fundamentals were not favorable to equities (2003 and 2012) the indicator identified stock market investment as a decent bet. 
Today the ratio between the S&P 500 and long dated US zeros stands at 75. 
This suggests that shares will become a buy in the coming months if they underperform bonds by a chunky 33%. The condition could also be met if US equities remain unchanged, but 30 year treasury yields decline from their current 3% to about 2%. Alternatively, shares could fall sharply, or some combination in between. 


Notwithstanding the continued relative strength of headline US economic data, I would note that the OECD leading indicator for the US is negative on a YoY basis, while regional indicators continue to crater. The key investment conclusion from my recession indicator is that equity positions, which face risks from worsening economic fundamentals, should be hedged using bonds or upping the cash component.
Like Outside the Box?

Sign up today and get each new issue delivered free to your inbox. It's your opportunity to get the news John Mauldin thinks matters most to your finances.


The article Outside the Box: A Worrying Set Of Signals was originally published at mauldineconomics.com.


Get our latest FREE eBook "Understanding Options"....Just Click Here!

Wednesday, September 30, 2015

The Fed’s Alice In Wonderland Economy - What Happens Next?

By Nick Giambruno

After the president of the United States, the most powerful person on the planet is the chairman of the Federal Reserve. Ask almost anyone on the street for the name of the U.S. president, and you’ll get a quick answer. But if you ask the same person what the Federal Reserve is, you’ll likely get a blank stare. They don’t know - partly due to the institution’s deliberately obscure name - that the Fed is really the third iteration of the country’s central bank. Or that the Fed manipulates the nation’s economic destiny by controlling the money supply.

And that’s just how the Fed likes it. They’d prefer Boobus americanus not understand the king like power they wield. By simply choosing to utter the right words, the chairman of the Fed can create or extinguish trillions of dollars of wealth both in and outside of the U.S. He holds the economic fate of billions of people in his hands. So it’s no shocker that investors carefully parse everything he says. They have to, if they want to be successful. Some even go as far as to analyze the almighty chairman’s body language. Of course, the mainstream financial media revere the Fed.

You may recall the unhealthy spectacle that occurred in 1996. That’s when Alan Greenspan, the Fed chairman at the time, spoke the now famous phrase “irrational exuberance” in what should have otherwise been a dull and forgettable speech. Investors heard Greenspan’s phrase to mean that the Fed would soon raise interest rates to slow the global economy. It’s worth mentioning that Greenspan didn’t actually say the Fed would raise rates. Nor did he intend to signal that.

Nonetheless, the reaction was swift and panicky. U.S. markets were closed at the time, but stocks in Japan and Hong Kong dropped 3%. The German stock market fell 4%. When trading started in the U.S. market the next day, the market opened down 2%. Billions of dollars of wealth vanished in a period of 16 hours. That’s the absurd power over the global economy that the Federal Reserve gives to one human being. The words of the chairman can make or break the fortunes of anyone with a brokerage account.

The Fed’s Alice in Wonderland Economy


I almost fell out of my chair when I heard it….. A journalist recently asked Janet Yellen, the current chair of the Federal Reserve, if the central bank would keep interest rates at 0% forever. Her response: “I can’t completely rule it out.” I was stunned. The deferential financial media hurried to ignore the significance of that statement. Instead, it acted the way big city police might act after making a messy arrest on a busy sidewalk. “Move along folks, nothing to see here!”

Clearly, there was something to see. Something very important. Yellen’s words came amidst one of the most anticipated economic pronouncements in a generation… whether the Fed would finally raise interest rates for the first time in nine years. Short term rates have been at zero since the 2008 financial crisis. Interest rates are simply the price of borrowing money. Setting them at an artificial level is nothing other than price fixing. Not surprisingly, it has led to enormous amounts of malinvestment and other distortions in the economy.

Malinvestment is the result of faulty decision-making. Any investor or business can make a mistake, but central bank manipulation of interest rates subsidizes bad, wasteful decisions. Cheap borrowing costs trick companies. It causes them to plow money into plants, equipment, and other assets that appear profitable because borrowing costs are low. Only later, when the profits don’t show up, do they discover that the capital was wasted.

Seven years of quantitative easing (QE) and Fed engineered zero interest rates have drawn the U.S. and much of the world into an unsustainable "Alice in Wonderland" bubble economy riddled with malinvestment. The pundits had expected that, at this recent meeting, the Fed would move to raise rates just a little and give the global economy a tiny taste of sobriety. Not even that nudge materialized.

Instead, the Fed sat on its hands. It kept interest rates at zero. And Janet Yellen couldn’t even rule out that rates would stay at zero forever. If she can’t even do that, how is she going to start a sustained series of rate hikes, as many of those same pundits now expect her to do a few months down the road?

The truth is, seven years of 0% yields and successive rounds of money printing has so distorted the U.S. economy that it can’t handle even the tiniest increase in interest rates. It would be the pin that pricks the biggest stock and bond market bubble in all of human history. The Fed cannot let that happen.

What Happens Next


It’s clear that the Fed can’t raise interest rates in any meaningful way. It would trigger a financial meltdown that would quickly force them to reverse course. The Fed might be able to get away with a token increase, but that’s all. In other words, the Fed has trapped itself. Former Fed chairman Ben Bernanke admitted as much recently when he said he didn’t expect rates to normalize in his lifetime.

And then, we have the current chair Janet Yellen saying that rates might stay at zero forever!

Yellen’s belief that she has the power to suppress interest rates until the end of time is a frightening sign. As powerful as the Fed is, it isn’t stronger than the markets. A crisis in the markets could force rates higher even if the Fed doesn’t want them to go there. And the longer the Fed tries to sustain abnormalities like QE and 0% interest rates, the more likely it is that the whole business will end with the markets crushing the Fed.

And that’s not even considering a collapse of the petrodollar system or China pushing the establishment of a New Silk Road in Eurasia…two catalysts that would likely force interest rates higher. So I’ll go ahead and disagree with Yellen and rule out the possibility that rates might stay at zero forever. They won’t, because they can’t.

At the next sign of a market swoon or of a weakening economy, or with the next episode of deflationary jitters, the Fed will again ramp up the easy money. It could be another round of QE. Or the Fed could push interest rates into negative territory. If that fails, the Fed could go for the nuclear option and drop freshly printed money out of helicopters as Bernanke once infamously suggested – or, more likely, into everyone’s bank account. They’ll do whatever it takes, no matter what the eventual damage to the dollar’s value.
Whatever the details, one thing should be clear. This politburo of unaccountable central planners is the greatest risk to your financial wellbeing today.

What You Can Do About It


It’s a terrifying thought that the actions of a few people at the Fed so endanger your financial security.
But the facts are worse than that. There’s more to worry about than just the financial effects. The social and political implications of the Fed’s actions are even more dangerous. An economic depression and currency inflation (perhaps hyperinflation) are very much in the cards. These things rarely lead to anything but bigger government, less freedom, and shrinking prosperity. Sometimes they lead to much worse.

Fortunately, your destiny doesn’t need to be hostage to what’s coming. We’ve published a groundbreaking step by step manual that sets out the three essential measures all Americans should take right now to protect themselves and their families. These measures are easy and straightforward to implement. You just need to understand what they are and how they keep you safe. New York Times best selling author Doug Casey and his team describe how you can do it all from home. And there’s still time to get it done without any extraordinary cost or effort.

Normally, this "get it done" manual retails for $99. But I believe it’s so important for you to act now to protect yourself and your family that I’ve arranged for anyone who is a resident of the U.S. to get a free copy.

Click here to secure your free copy.

The article was originally published at internationalman.com.


Get our latest FREE eBook "Understanding Options"....Just Click Here!

Thursday, September 24, 2015

The Bull Market is Over

By Justin Spittler

Stocks had a horrible day Tuesday. The S&P 500 lost 1.23%. The Dow Jones Industrial Average lost 1.09%. Indices around the world also fell. The Euro Stoxx 600, which tracks 600 of Europe’s biggest companies, lost 3.12%. Germany’s DAX lost 3.80%. Japan’s Nikkei 225 lost 1.96%.

Casey Report readers know this is part of our “script”…..

The S&P 500 plunged into its first correction since 2011 on August 23. A correction is when an index falls 10% or more from its last high. In total, the S&P 500 plunged 11% in 6 days. In the latest issue of The Casey Report, E.B. Tucker told his readers that this big drop marked the end of the 6 year bull market in U.S. stocks. He wrote: We believe the era of asset prices soaring on a wave of easy credit is over. Last month’s major stock market decline is the start of a very tough time for stocks and the economy.

This bull market is unraveling because it was built on easy money. E.B. explains how the Federal Reserve’s easy money policy has propped up the price of almost everything. The Fed’s easy money policy has lifted the price of just about every asset over the past six years. Cars, luxury watches, art, boats…just about everything that’s for sale costs more than it did a couple years ago. That’s especially true of the stock market.

The Fed cut its key interest rate to effectively zero during the last financial crisis. And it’s kept it there ever since. Low interest rates were supposed to boost the economy. But they’ve also pushed up the price of stocks and encouraged reckless borrowing, as E.B. explains: By making enormous amounts of credit available, the Fed stoked the economy, stocks, and the housing market. Stocks tripled from their 2009 lows. Average U.S. home prices climbed 50% from their previous lows. Companies with poor credit ratings borrowed record amounts of money...far more than they did before the 2008 crisis.

E.B. went on to explain how high stock and home prices were masking a huge problem: In 2015, the total net worth of American households reached $85 trillion, an all-time high. On the surface, things look good. But the long period of low interest rates has created an extremely dangerous situation. By taking interest rates to zero and holding them there for nearly seven years and counting, the Fed has created bad investments and reckless speculation on an epic scale. Not billions...but trillions.

The crash last month pushed U.S. stocks below an important long-term trend line…..

E.B. explains why this is such a big deal: A long term trend line shows the general direction the market is heading. Many professional traders use it to separate normal market gyrations from something bigger. Think of it as a “line in the sand.” As you can see from the chart below, there have been a few “normal” selloffs since 2011. On Friday, August 21, however, the S&P dropped below its long term trend line for the first time in about four years.

  
U.S. stocks rebounded after last month’s crash…..

But E.B. told his readers the rebound was only temporary. He said the market was in the middle of a “dead cat bounce.” E.B. thinks U.S stocks will keep falling, in part because they’re so expensive.

Right now, the S&P’s CAPE ratio is 24.6, about 48% more expensive than its average since 1881.
The S&P has only been more expensive a handful of times since 1881. That includes the years around the 1929, 2000, and 2007 market peaks.

CAPE is a popular valuation metric. It’s the price to earnings (P/E) ratio with one adjustment. Instead of using one year of earnings, it uses earnings from the past 10 years. This smooths out the effects of booms and recessions and provides a useful, long term view of the market.

The chart below shows that the market eventually collapsed after the high CAPE periods around the 1929, 2000 and 2007 market peaks:


The Fed’s easy money policies have fueled a reckless debt binge...

And debt acts like dynamite when a financial crisis hits. We’re in a very fragile situation. E.B. thinks last month’s brutal selloff in U.S. stocks was just the beginning. Things are likely to get much worse from here. But they don’t have to get worse for you. E.B. can be your “personal guide” as this 6-year bull market continues to unravel. He’s recently shown readers how to profit from crashing oil prices and the digital revolution in money. You can read all about E.B.’s favorite investing opportunities every month in The Casey Report.

Right now we’ll send you a FREE 30-day subscription to The Casey Report when you order Going Global 2015…one of the most important books we’ve ever published. Going Global shows you how to move your wealth outside the “blast radius” of any financial crisis.

We usually sell Going Global for $99. But we’re virtually giving away a very limited number of hard copies. All we ask is that you pay $4.95 to cover our processing costs.

Why are we practically giving away so much of our best research? Because we hope that after trying what is essentially a free sample of some of our best and most valuable work, you’ll want to do business with us again.

Click here to claim your hardcover copy of Going Global 2015 and your FREE 30 day subscription to The Casey Report.

The article The Bull Market is Over was originally published at caseyresearch.com.


Get our latest FREE eBook "Understanding Options"....Just Click Here!

Stock & ETF Trading Signals