Monday, January 15, 2018

How to Know if This Rally Will Continue for Two More Months

Our trading partner Chris Vermeulen has our readers off to an amazing start for 2018. If this is any sign of what we have to come this year we are in store for one of our best years of trading possibly ever. 

Chris just sent over his latest article and it explains how our old reliable Transportation Index is guiding the way once again. Read "How to Know if This Rally Will Continue for Two More Months".

Our research has been “spot on” with regards to the markets for the first few weeks of 2018. We issued our first trade on Jan 2nd, plus two very detailed research reports near the end of 2017 and early 2018. We urge you to review these research posts as they tell you exactly what to expect for the first Quarter in 2018.

Continuing this research, we have focused our current effort on the Transportation Index, the US Majors, and the Metals Markets. The Transportation Index has seen an extensive rally (+19.85%) originating near November 2017. This incredible upside move correlates with renewed US Tax policies and Economic increases that are sure to drive the US Equity market higher throughout 2018.

In theory, the Transportation Index is a measure of economic activity as related to the transportation of goods from port to distribution centers and from distribution centers to retail centers. The recent jump in the Transportation Index foretells of strong economic activity within the US for at least the next 3 months.

Get our Free Technical Traders Wealth Building Newsletter....Get it Here 

One could, and likely should watch the Transportation Index for any signs of weakness or contraction which would indicate an economic slowdown about to unfold. In order to better understand how the Transportation Index precedes the US Equity markets by 2-5 months, let’s compare the current price activity to that of 2007-08.

This first chart is the current Transportation Index and shows how strong the US economic recovery is in relation to the previous year (2017). As the US economy has continued to strengthen and open up new opportunities, the Transportation Index has related this strength by increasing by near +20% in only a few short months. This shows us that we should continue to expect a moderate to strong bullish bias for at least the first quarter of 2018 – unless something dramatic changes in relation to economic opportunities.

Current Transportation Index Chart


In comparison, this chart (below) is the Transportation Index in 2007-08 which reacted quite differently. The economic environment was vastly different at this time. The US Fed had raised rates consecutively over a two year period leading up to a massive debt/credit crisis. At the same time, the US had a Presidential Election cycle that saw massive uncertainty with regards to regulation, policies and economic opportunities. Delinquencies as related to debt had already started to climb and the markets reacted to the economic alarms ringing from all corners of the globe. The Transportation Index formed a classic “rollover top” formation in late 2007 and early 2008 well before the global markets really began to tank.

2007-08 Transportation Index Chart


Our analysis points to a very strong first quarter of 2018 within the US and for US Equities. We believe the economic indicators will continue to perform well and, at least for the next 3 months, will continue to drive strong equity growth. We do expect some volatility near the end of the first Quarter as well as continued 2-5% price volatility/rotation at times. There will be levels of contraction in the markets that are natural and healthy for this rally. So, be prepared for some rotation that could be deeper than what we have seen over the last 6 months.

In conclusion, equities are this point are overpriced, and overbought based on the short term analysis. We should be entering slightly weaker time for large cap stocks over the next couple weeks before it goes much higher. Because we are still in a full out bull market, Dips Should Be Bought and we will notify members of a new trade once we get another one of these setups.

In our next post, we are going to talk about two opportunities in precious metals forming for next week!

Read the analysis we presented before the end of 2017 regarding our predictive modeling systems and how we target our research to helping our members. If you believe our analysis is accurate and timely, then we urge you to subscribe here at The Technical Traders to support our work and to benefit from our signals. We believe 2018 – 2020 will be the years that strategic trades will outperform all other markets. Join us in our efforts to find and execute the best trading opportunities and profit from these fantastic setups.

Chris Vermeulen
Technical Traders Ltd.


Stock & ETF Trading Signals

Sunday, January 7, 2018

Preparing for the Cryptocurrency Swan Event

Our trading partner Chris Vermeulen sent over this great article he put together covering how the current crypto markets volatility might affect the rest of the markets. 

Many people have speculated that Cryptocurrencies can go to $10k or higher. Recently, the Chinese government has stepped up policy to regulate and eliminate Crypto ICOs as a means of increased speculation and gray market capital. Additionally, Jamie Dimon, of JP Morgan, stated that Bitcoin is a fraud and that it would “blow up” (MSN > Bitcoin is a Fraud That Will Blow Up Says JP Morgan Boss). What is the truth and what should investors expect in the future? Well, here is my opinion on this topic.

Bitcoin is based on the Blockchain technology architecture. I believe this architecture will continue to be explored under the basis of an open, distributed ledger method of developing opportunities. This technology improvement will likely drive advancement in other sectors of the global market as security and accountability continue to increase. Yet, the growing pains of this technology will likely continue to drive some wild moves over the next few years.

It has been reported that Cryptocurrencies fell $23 Billion in value since the peak. This would put the total valuation of the Crypto market at about $117 Billion near the same peak. Consider for a moment that the Bernie Madoff scandal was near $65 Billion total. Could a Cryptocurrency based “Swan Event” create chaos in the global markets?


In comparison to more traditional investment instruments, the risk exposure of Cryptocurrencies seems somewhat limited. Yet consider this… Many global firms jumped onto the Blockchain bandwagon within the last 12~24 months. This is not just individual investors any longer, this is most of the global financial market.

DATE TIMELINE OF FIRST INVESTMENT INTO CRYPTOCURRENCIES


So, now our “Swan Event” has a bit of depth in terms of risk exposure and breadth in terms of global market reach. What would an extended decline in Cryptocurrency valuations do to these firms and to the confidence in the Cryptocurrency market?


Could a collapse “Swan Event” drive prices back to below $1000 (USD) or further? What would the outcome of such an event be like for the global markets? Would this type of move reflect into the global market as an advance or decline overall? And what would this mean to the bottom line of these financial firms that have invested capital, resources and client’s capital into these markets?

It is our believe that the global markets are, without a Cryptocurrency event, setting up for a potentially massive corrective move. The chart, below, clearly shows what we believe to be a Head-n-Shoulders pattern forming that will likely prompt a breakdown move near October 2017 or shortly thereafter.

We believe this global market correction will prompt selling in weaker instruments and drive a massive “rip your face off” rally in the metals. We believe this move has already started with the formation of the Head-n-Shoulders pattern in the US markets as well as the recent upside move in the metals. The Cryptocurrency “Swan Event” may be the catalyst event that is needed to put pressure on other market instruments (US and Global equities, RealEstate, Consumer confidence/spending and Metals).

U.S. CUSTOM INDEX....HEAD-N-SHOULDER FORMATION


METALS : START OF RIP YOUR FACE OFF RALLY


REAL ESTATE CORRECTION


Are you prepared for this move? Do you want to know what to expect and do you need help understanding these market dynamics? The markets are setting up for what could be one of the most explosive cycle event moves in nearly a decade and you need to be prepared. We offer our research to our clients at The Market Trend Forecast for far less than you would imagine. For less than $1 per day, you can have access to our advanced research and analytics, market trend forecasts and more. We keep you informed with our timely updates and research to help you understand how these markets are moving, where to find opportunities and how to protect your investments.

Our research team has over 30 years experience in the markets and have been trained by some of the best technicians that ever lived. Isn’t it time you invested in a team of dedicated market analysts that can help you protect your assets and find opportunities for an unbelievable subscription rate?

When you join, we’ll send your our Guide to understanding trading PDF booklet to help you understand our advanced analysis techniques and adaptive learning strategies. These are all part of our commitment to providing you the best analysis, research and understanding of the market’s dynamics as well as making sure you understand what we are delivering to you each week.

Don’t miss this next big move, the “Swan Event”....Timing is everything.

Visit The Technical Traders Right Here to see what we are offering you.

Chris Vermeulen

Just Getting Started Trading Cryptocurrency?  Get $10.00 Worth of FREE Bitcoin Right Here

Friday, December 29, 2017

2018 First Quarter Technical Analysis Price Forecast

As 2017 draws to a close, our analysis shows the first Quarter of 2018 should start off with a solid rally. Our researchers use our proprietary modeling and technical analysis systems to assist our members with detailed market analysis and timing triggers from expected intraday price action to a multi-month outlook.

These tools help us to keep our members informed of market trends, reversals, and big moves. Today, we are going to share some of our predictive modelings with you to show you why we believe the first three months of 2018 should continue higher.

One of our most impressive and predictive modeling systems is the Adaptive Dynamic Learning system. This system allows us to ask the market what will be the highest possible outcome of recent trading activity projected into the future. It accomplishes this by identifying Genetic Price/Pattern markers in the past and recording them into a Genome Map of price activity and probable outcomes.

This way, when we ask it to show us what it thinks will be the highest probable outcome for the future, it looks into this Genome Map, finds the closest relative Genetic Price/Pattern marker and then shows us what this Genome marker predicts as the more likely outcome.

This current Weekly chart of the SPY is showing us that the next few Weeks and Months of price activity should produce a minimum of a $5 – $7 rally. This means that we could see a continued 2~5% rally in US Equities early in 2018.


Additionally, the ES (S&P E-mini futures) is confirming this move in early 2018 with its own predictive analysis. The ADL modeling system is showing us that the ES is likely to move +100 pts from current levels before the end of the first Quarter 2018 equating to a +3.5% move (or higher). We can see from this analysis that a period of congestion or consolidation is expected near the end of January or early February 2018 – which would be a great entry opportunity.


The trends for both of these charts is strongly Bullish and the current ADL price predictions allow investors to understand the opportunities and expectations for the first three months of 2018. Imagine being able to know or understand that a predictive modeling system can assist you in making decisions regarding the next two to three months as well as assist you in planning and protecting your investments? How powerful would that technology be to you?

Our job at Technical Traders Ltd. is to assist our members in finding and executing profitable trades and to assist them in understanding market trends, reversals, and key movers. We offer a variety of analysis types within our service to support any level of a trader from novice to expert, and short term to long term investors.

Our specialized modeling systems allow us to provide one of a kind research and details that are not available anywhere else. Our team of researchers and traders are dedicated to helping us all find great success with our trading.

So, now that you know what to expect from the SPY and ES for the next few months, do you want to know what is going to happen in Gold, Silver, Bonds, FANGs, the US Dollar, Bitcoin, and more?

Join The Technical Traders Right Here to gain this insight and knowledge today.

Chris Vermeulen

Stock & ETF Trading Signals

Wednesday, December 20, 2017

Today's Gap Fill and Prediction Complete, What's Next?

Subscribers of our Technical Traders Wealth Building Newsletter were told before the market opened that stocks were set to gap higher and then fill the price gap. Only 12 minutes after the market opened the gap window was filled for a 9.5 pt move in the SP500, which is a quick $475 profit for those trading futures, or $103 profit per 100 shares traded of the SPY ETF.


Yesterdays Gap Fill Forecast


If you want to know what the market are going to do today, this week, and next month be sure to subscribe to our new and improved market trend forecast and trading newsletter....

Visit "The Technical Traders ETF Cycle Trader" Right Here


Monday, December 18, 2017

Should You Consider Investing/Buying Gold or Bitcoin?

Our trading partner Chris Vermeulen of The Technical Traders just put together this great article comparing Bitcoin against traditional commodities for investing and storing wealth....

Recently, we have been asked by a number of clients about the precious metals and what our advice would be with regards to buying, selling or holding physical or trading positions in the metals.  There are really only a few short and simple answers to this question and they are revolve around the concept of providing a hedge against risk, capital preservation and opportunity for returns.  Let’s explore the details a bit further.
First, Gold, historically, has been and will continue to be the basis of physical wealth for the foreseeable future.  Currently, Gold and Silver are relatively low cost compared to other assets offering similar protection.   As of right now, Gold and Silver are nearing the lowest price ratio levels, historically, that have existed since 1990.  This means, the relationship of the price ratio for Gold and Silver are comparatively low in relationship to how Gold and Silver are priced in peak levels.  So, right now is the time to be acquiring Gold and Silver as a low price hedge against another global crisis event or market meltdown.
People are starting to park their money in digital currencies, like Bitcoin and Ethereum, rather than parking them in fiat currencies – I buy and hold my currencies in this crypto wallet CoinBase. This is primarily due to the Negative Interest Rate Policy as well as Zero Interest Rate Policy of the Central Banks, which explains the sharp rise in the price of Bitcoin, this year.
Taking a look at this chart of the DOW Index shown in relative Gold Ounce price levels, we can see that every peak in this ratio above 15 or so has resulted in a dramatic ratio level reversion (decline).  This reversion means that asset prices (the DOW price level) declined while the price of Gold rose or stayed relatively stable.  The current level is well above 17 and any peak in this level should start the next rally in precious metals while global equities contract.


Second, the fact that the Gold and Silver price ratio is historically very low (meaning they provide a very good hedging opportunity at historically very low price ratio levels) also means that cash can be traded for physical gold with very limited risk and provide an excellent hedge for inflation, global market crisis events and as long term investments.  Taking advantage of the current market conditions, one has to be aware that crisis events do exist and present a clear risk to future equity investments.

One could decide to risk further capital hedging with options or short positions as risk becomes more evident, but these are inherently more risky than a physical Gold or Silver investment.  Physical Gold or Silver, especially rare coins which include greater intrinsic value, can provide real capital, real gains, real hedging of risk and real return – whereas the short positions or options are only valuable if the trade is executed to profit.
The relationship of the US Dollar to Gold is key to understanding precious metals valuations.  As the US Dollar increases in value, this puts pressure on the price of Gold because most of the world operates in US Dollars and Gold is typically a hedge against risk and inflation.  Therefore, as the US Dollar increases in value, there is a perceived view that risks and inflation are less of a threat to the global economy.
As this chart, below, shows, the US Dollar is currently settling within a FLAG formation that could result in downside price action – below recent support.  When we consider the first chart, showing the price of Gold being historically very cheap and the ratio being above 17, we must assume that any downside price activity in Gold is a blessing right now because these levels have not been seen since 1999, 1965 or 1929.  In other words, this is potentially a once-in-a-lifetime opportunity for investors.

Lastly, Gold and Silver are very limited in supply on this planet and, unless society decides that Gold or Silver is absolutely worthless as a substance, will likely continue to increase in value.  News that China and Russia are acquiring hundreds of tons of gold each year in preparation for a gold based currency is another set of reasons that you should consider starting your own physical hoard of precious metals.

The most important thing for you to understand about owning physical Gold and Silver is that it is a protective investment that can be liquidated or resold at almost any time in the future.  It can be traded, held, secured and transported easily.  You can physically take possession of your Gold and Silver and be assured that through any banking crisis, global market crisis or major global event, you have enough physical precious metal to operate in a crisis mode and likely attain great wealth/gains in the process.
Think of physical Gold and Silver like an “emergency kit”.  You hope you never need it, but when you do need it, you had better be prepared and have set aside some physical holdings before the crisis event happened.  Out here in California, we keep “Earthquake Kits” with emergency supplies, water, lanterns, food and other essentials.  Well, guess what is included in my Earthquake Kit?  Yup – Gold and Silver in proper quantities that I could barter and trade for items that are essential.
This final chart is the Gold to Silver ratio and is used to identify when price disparity between the two most common precious metals is opportunistic for one metal over the other.  When the price of Gold is high compared to the price of Silver, this ratio will climb.  When the price of Silver increases, because of perceived market risks, this ratio will decline.  Currently, one can see that we are nearing a peak in this ratio chart – meaning that Silver is much cheaper, in relative terms, than gold.  Because of this, investors should consider Silver and Gold as viable wealth protection.
Should another market crisis event unfold, both Silver and Gold will likely rally.  This chart is telling us that Silver will likely rally by a larger percentage value than Gold to result in a decline in this ratio and resulting in closer “parity” between the valuations of these two precious metals.  Again, currently, this is very close to a once-in-a-lifetime opportunity for investors.

The point of my post is that I can think of no reasons why anyone would not want to attain some physical Gold and Silver at today’s prices to protect against known risks, provide a hedge against inflation and crisis events and to protect wealth from what we all know will happen in a crisis event – the banks will close or limit cash availability (think of Greece).  So, it is really up to you to determine if and how you want to prepare for what could happen in the future.  Will you have your “emergency kit” and be prepared or not?
Now is the time to consider building your “emergency kit” and to prepare for the next market crisis event.  Our research team is ready to assist you and to keep you updated with Daily and Weekly update for all the major markets.
Visit The Technical Traders Here to learn more about our services and newsletters today.
Stock & ETF Trading Signals

Monday, December 4, 2017

Forget the Needle, Trade the Haystack

2017 is just about done and it's time to look at what worked and what didn’t. If you have gains, you want to protect them. If you have losses, you want to turn things around. With over 10,000 stocks to choose from, sometimes trading can feel like searching for a needle in a haystack.

But you don’t have to try to pick the right stock in the ‘haystack’. With Exchange Traded Funds (ETFs), you can just buy the whole haystack, especially when you’re taking advantage of ETF options.

To show you the right way to take advantage of ETF options, our friend John Carter, CEO of Simpler Trading, is putting on a live FREE interactive webinar just for our readers.

Register Here

If you haven’t heard of John before, he’s traded for over 25 years. He’s not only written a bestselling book on trading [check out Mastering the Trade right here], he’s also earned quite a reputation for catching huge moves.

2017 over $600 billion was poured into ETFs and John sees an even bigger year ahead in 2018. That’s why he’s so focused on his ETF options strategy. You can hedge against your portfolio while limiting your risk. You can even profit from your hedge.

John covers all that, plus:

  *   Why ETFs have powerful advantages even the newest of traders can exploit

  *   When to go for maximum leverage using double and TRIPLE leverage ETF options

  *   How ETF traders can cherry pick sectors to always ‘follow the big money’

  *   How to properly hedge against corrections and crashes without erasing gains

  *   How to take full advantage of the new Bitcoin ETF when it arrives

  *   The latest tools for identifying setups with the potential for triple digit gains (or more)


And a whole lot more.…

When it comes to ETF strategies, the opportunities are vast, There’s something for just about every trading style, from day trading to long term positions, and of course, hedging your portfolio. We got John to break it down for you and make it as simple as possible to maximize your profit potential through ETF options.

If you’re interested, go ahead and grab a spot for this training.

Go HERE to Register

See you Tuesday night!

Simpler Trading

Thursday, November 30, 2017

Capital Repositioning Driving Volatility Higher

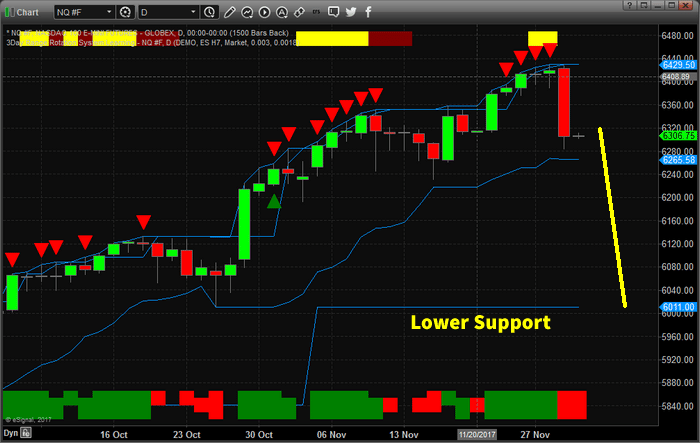
Recent moves in the FANG stocks shows that capital is starting to reposition within the global market.  As the end of the year approaches, expect more of this type of capital control to drive greater volatility within the markets.  At this time of year, especially after such a fantastic bullish run, it is not uncommon to see capital move out of high flying equities and into cash or other investments.
The recent move lower in the NQ has taken many by surprise, but the bullish run in the FANG stocks has been tremendous.  Facebook was higher +59% for 2017 (600% 2016 levels).  Amazon was up +61% for 2017 (550% 2016 levels).  Netflix was up +64.75% for 2017 (600% 2016 levels) and Google was higher by +37% for 2017 (1000% 2016 levels).  These are huge increases in capital valuation.
In early 2017, we authored an article about how capital works and always seeks out the best returns in any environment.  It was obvious from the moves this year that capital rushed into the US markets with the President Trump’s win and is now concerned that the end of the year may be cause to pull away from the current environment.
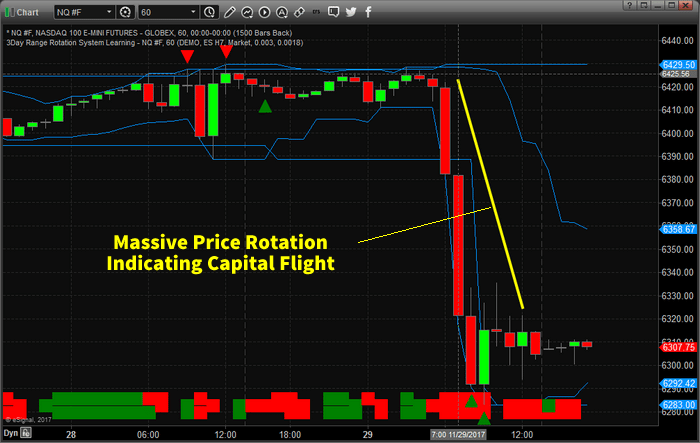
The current decline in the NQ, -2.25% so far, is not a huge decline in price yet.  Lower price support is found near the $6000 level.  Should this “Price Flight” continue in the NASDAQ, we could be looking at a 6~8% decline, or greater, going into the end of this year.
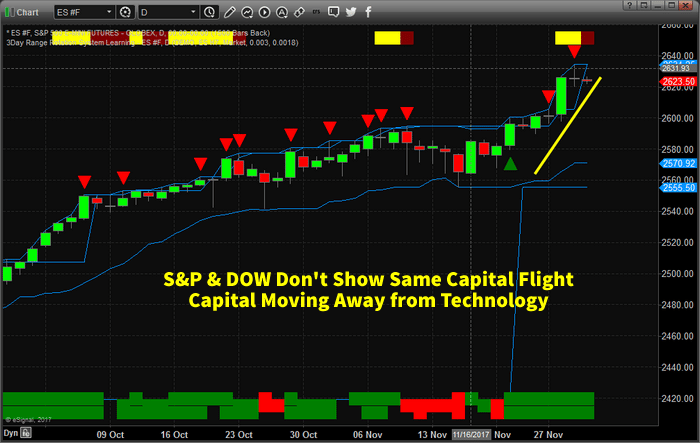
The price swing, this week, was very fast and aggressive.  In terms of capital, this was a massive price rotation away from Technology.  While the S&P and DOW Industrials continue higher, this presents a cause for concern with regards to the end of year expectations.
Will capital continue to rush into the US markets and specifically Technology stocks?  Or will capital rush out of these equities and into other sources of “safety” as technology melts down into the end of 2017?  Has the 40~60%+ price rally of 2017 been enough for investors to take their profits and run?
It is quite possible that capital will move to the sidelines through the end of this year and reenter the markets early next year as investors find a better footing for the markets.  The facts are, currently, that financials and transportation seem to be doing much better than the FANG stocks.  If this continues, we could be looking at a broader shift in the global markets – almost like a second technology bubble burst.
If you want to learn more about how we can assist you with your investment needs, visit The Technical Traders Here to learn more.  Our researchers are dedicated to assisting you and in helping you learn to profit from these moves.  2018 is certain to be a dynamic trading year – so don’t miss out.


Stock & ETF Trading Signals


Monday, November 20, 2017

Could a Bitcoin Blowout coincide with a Major Market Blowout?

Our team of researchers continues to attempt to identify market strengths and weakness in the US major markets by identifying key, underlying factors of the markets and how they relate to one another.

Recently, we’ve been warning of a potentially explosive bullish move in Metals and our last article highlighted the weakness in the Transportation Index as it relates to the US major markets. 

On November 2, 2017, we warned that the NQ volatility would be excessive and that any move near or below 6200 would likely prompt support to drive prices higher as our Adaptive Dynamic Learning model was showing wide volatility and the potential for rotation moves.

This week, we are attempting to highlight a potential move in Bitcoin that could disrupt the global economy and more traditional investment vehicles.  For the past few years, Bitcoin has been on a terror to the upside.  Recently, a 30% downside price rotation caused a bit of panic in the Crypto world.  This -30% decline was fast and left some people wondering what could happen if something deeper were to happen – where would Crypto’s find a bottom.  From that -30% low, Bitcoin has recovered to previous highs (near $8000) and have stalled – interesting.
While discussing Bitcoin with some associates a while back, I heard rumor that a move to Bitcoin CASH was underway and that Bitcoin would collapse as some point in the near future. The people I was meeting with were very well connected in this field and were warning me to alert me in case I had any Bitcoin holdings (which I do).  I found it interesting that these people were moving into the Bitcoin CASH market as fast as they could.  What did they know that I didn’t know and how could any potential Bitcoin blowout drive the global markets?
Panic breeds fear and fear drives the markets (fear or greed).  If Bitcoin were to increase volatility beyond the most recent move (-30% in 4 days) – what could happen to the Crypto markets if a bubble collapse or fundamental collapse happened?


How would the major markets react to a Crypto market collapse that destroyed billions in capital?  For this, we try to rely on our modeling systems and our understanding of the major markets.  Let’s get started by looking at the NASDAQ with two modeling systems (the Fibonacci Price Modeling System and the Adaptive Dynamic Learning system).
This first chart is a Daily Adaptive Dynamic Learning (ADL) model representation of what this modeling system believes will be the highest probability outcome of price going forward 20 days.  Notice that we are asking it to show use what it believes will happen from last week’s trading activity (ignoring anything prior).  This provides us the most recent and relevant data to review.
We can see from the “range lines” (the red and green price range levels shown on the chart), that upside price range is rather limited to recent highs whereas downside prices swing lower (to near 6200 and below) rather quickly.  Additionally, the highest probability price moves indicate that we could see some downside price rotation over the Thanksgiving week followed by a retest of recent high price levels throughout the end of November.


This NQ Weekly chart, below, is showing our Fibonacci price modeling system and the fact that we are currently in an extended bullish run that, so far, shows no signs of stalling.  The Fibonacci Price Breach Level (the red line near the right side of the chart) is showing us that we should be paying attention to the 6075 level for any confirmation of a bearish trend reversal.  Notice how that aligns with the blue projected downside support level (projected into future price levels).  Overall, for the NQ or the US majors to show any signs of major weakness, these Fibonacci levels would have to be tested and breached.  Until that happens, expect continued overall moderate bullish price activity.  When it happens, look out below.

The next charts we are going to review are the Metals markets (Gold and Silver).  Currently, an interesting setup is happening with Silver.  It appears to show that volatility in the Silver market will be potentially much greater than the volatility in the Gold market.  This would indicate that Silver would be the metal to watch going into and through the end of this year.  This first chart is showing the ADL modeling system and highlighting the volatility and price predictions that are present in the Silver market.  Pay attention to the facts that ranges and price projections are rather stable till about 15 days out – that’s when we are seeing a massive upside potential in Silver.
This next chart is the Fibonacci Price Modeling system on a Weekly Silver chart.  What is important here is the recent price rotation that has setup the Fibonacci Price Breach trigger to the upside (currently).  This move is telling us that as long as price stays above $16.89 on a Weekly closing price basis, then Silver should attempt to push higher and higher over time.  The projected target levels are $19.50, $20.25 and $21.45.  Notice any similarity in price levels between the Fibonacci analysis and the ADL analysis?  Yes, that $16.89 level is clearly identified as price range support by the ADL modeling system (the red price range expectation lines).


How will this playout in our opinion with Bitcoin potentially rotating lower off this double top while the metals appear to be basing and potentially reacting to fear in the market?  Allow us to explain what we believe will be the most likely pathway forward…
At first, this holiday week in the US, the markets will be quiet and not show many signs of anything.  Just another holiday week in the US with the markets mostly moderately bullish – almost on auto-pilot for the holidays.  Then closing in on the end of November, we could start to see some increased volatility and price rotation in the metals and the US majors.  If Bitcoin has moved by this time, we would expect that it would be setting up a rotational low above the -30% lows recently set.  In other words, Bitcoin would likely fall 8~15% on rotation, then stall before attempting any further downside moves.
By the end of November, we expect the US markets to have begun a price pattern formation that indicates sideways/stalling price activity moving into the end of this year.  This ADL Daily ES Chart clearly shows what is predicted going forward 20 days with price rotating near current highs for a few days before settling lower (near 2540~2550 through early Christmas 2017).  The ADL projected highs are not much higher than recent high price levels, therefore we do not expect the ES to attempt to push much higher than 2595 in the immediate future.  It might try to test this level or rotate a bit higher as a washout high, but our analysis shows that prices should be settling into complacency for the next week or two while settling near the lower range of recent price activity.


What you should take away from this analysis is the following : don’t expect any massive upside moves between now and the end of the year that last longer than a few days.  Don’t expect the markets to rocket higher unless there is some unexpected positive news from somewhere that changes the current expectations.  Expect Silver to begin to move higher in early December as well as expect Gold to follow Silver.  We believe Silver is the metal to watch as it will likely be the most volatile and drive the metals move.  Expect the major markets to be quiet through the Thanksgiving week with a potential for moderate bullish price activity before settling into a complacent retracement mode through the end of November and early December.
If Bitcoin does what we expect by creating a rotational lower price breakout setup from recent highs, we’ll know within a week or two.  If this $8000 level holds as resistance, then we will clearly see Bitcoin rotate into a defensive market pattern (a flag formation or some other harmonic pattern above support).  The US majors will likely follow this move as a broader fear could begin gripping the markets.
Lastly, as we mentioned last week, pay very close attention to the Transportation Index and it’s ability to find/hold support.  Unless the Transportation index finds some level of support and begins a new bullish trend, we could be in for a more dramatic move early next year.  Our last article clearly laid out our concerns regarding the Transportation Index and the broader market cycles.  All of our analysis should be taken as segments of a much larger market picture.  We are setting up for an interesting holiday season where the market could turn in an instant on fear or news of some global event (like a Bitcoin collapse).  The volatility we are seeing our modeling systems predict is increasing (especially in the Silver market over the next few weeks).  We could be headed for a bumpy ride with a classic top formation setting up.


Overall, protect your investments and your long positions.  Many people will be away from their PCs and away from the markets over the holidays.  It is important that you understand the risks that continue to play out in the markets.  Pay attention to market sectors that are at risk of showing us greater fear or weakness in the major markets.  Pay attention to these increases in volatility and price rotation.  Most of all, pay attention to the market’s failure to move higher over this holiday season because we should be traditionally expecting the Christmas Rally to push equities moderately higher at this time.
Should we see any more clear signs of weakness or market rotation, you will know about it with our regular updates to the public.  If you want to know how Acitve Trading Partners can assist you in staying up to day with the market cycles and analysis, then visit the Active Trading Partners and learn how we can assist you with detailed market research, daily updates, trading signals and more.
We are dedicated to helping you achieve success in the markets and do our best to make sure you are prepared for any future market moves.  See how we can assist you now and in 2018 to achieve greater success.

Stock & ETF Trading Signals

Tuesday, November 7, 2017

The Iron Rule of the Financial Markets

This math formula that can literally predict the market:    dxt=θ(μ−xt)dt+σdWt

John Bogle the founder of The Vanguard Group, calls it the iron rule of the financial markets. Jason Zweig from the Wall Street Journal says it’s the most powerful law in finance.

Legendary trader James O'Shaughnessy says that historically, we have always seen it driving stocks. And over the last 8 years it could have paid you well in consistent reliable profits.

Now I’m Going To Show You How It Works ← Click Here

If you trade it with options it could produce rapid two week individual trade profits like....

  *  204% on XLU Put Options

  *  124% on XLE Call Options

  *  And even as much as 998% on XLE Put Options

  *  All in precisely two weeks - no more, no less.

Get The Facts ← Click Here

My trading partner Todd Mitchell has recorded a three video series explaining how it works. He’s making it available to you now - 100% for FREE.

This series will only be available for a very limited time. If you want to watch…

Visit Here to Check it Out Right Now

See you in the Markets!
Ray C. Parrish
aka the Crude Oil Trader


Monday, October 2, 2017

Engineering Regular Income and Profits from Your Trading

Today's article is from my trading partner, Brian McAboy of Inside Out Trading.  Brian is a retired engineer and has a rather unconventional yet very effective approach to helping people become successful traders.  He's been helping traders for over 11 years, so he's been around long enough to know what works and what doesn't.

Take just a minute for this.  You'll be glad you did.


There are two very specific success traits that pertain to you and your trading. The first one is absolutely necessary for you to give yourself a reasonable chance of making it. And the second one is to keep you from wasting tons of time, money and psychological capital

Now as you know, trading is not a "get rich quick" kind of activity. This is NOT a place where anyone off the street can stroll in, grab a system, start throwing money at the markets and live happily ever after. Just doesn't work like that

Trading IS a true profession, a skill based occupation, and not a place for the squeamish or weak of heart. So for a person to expect to be "living the lifestyle" overnight is just not realistic. But the question then becomes, "How long should it realistically take?"

Too many traders let things go way too long in a less than satisfactory state

They simply let time to continue to pass, doing things generally the same way they have been for months on end, with the same disappointing results, well beyond what is really a reasonable time to allow

You see, there are generally two aspects of patience when it comes to trading:
  1. You have to be patient enough for things happen, for your trading to develop and mature.
  2. The other side of patience is knowing when you've reached a point where it's pretty obvious that your current approach just isn't working and it's time to stop, reassess, and change course.
"How long should it take?" is a common question, and the real answer is that you can get to the point of real, business like, reliable consistent profits in 3 to 6 months, a year at the outside

If it's taking YEARS, then something is wrong and you're really just spinning your wheels, wasting time and money and cheating yourself out of the success that you should be enjoying. There is also a huge personal cost to letting things take longer than they should

One trader expressed this very well,
"I've been trading futures for about 9 years now with inconsistent results.  I've made the usual mistakes, buying too many courses, focusing on the results not the process and being too impatient to trade to wait for valid setups. 

After listening to your video this weekend where you make the distinction between being patient in the beginning and giving yourself time, and beyond a certain point (3 - 6months) considering that it may be time to be impatient about your progress, this made me realize I've been allowing myself to coast for far too long, and that's impacted my confidence and the belief that I can turn trading into a business with a consistent return." 
Complacency, NOT being impatient when it's time to, is one of the biggest cost centers many traders have

There's the financial cost of missed profits and unnecessary losses, plus the opportunity costs of not enjoying the fruits of your time being spent on other matters of course, but she noted the personal, psychological cost as well

The thing is, you chose trading so that you could have freedom, financial and time freedom, not a J-O-B. You wanted trading to be a truly enjoyable activity that generates income and wealth and provides security and peace of mind

If you've been trading for more than a year, and your trading is not where you want it to be, nor is it really even close, and looking at the trajectory that you're now on, it doesn't look like you're going to get there anytime soon, then perhaps it's time to consider a different approach. That's why I suggest that you check out the training masterclass I created for you

Here are the details on the masterclass,

 "Rewrite Your Trading Story"

How to become a confident, consistent and profitable trader in 60 days or less even if you've never had a profitable month.

Here's what you will discover....
  • The "Little 3" and the "Big 3" and Why the Wrong Focus Will Have You Chasing Profits Forever
  • "The Gap" and How It Keeps Traders Jumping From One System to the Next, Without Ever Realizing The 'Easy Consistent Profits' Promised by the System Sellers
  • One Specific 'Hidden' Lie Traders Tell Themselves That Continually Drains Your Time, Capital and Confidence
  • Why Self Sabotage Goes On For YEARS For Most Traders, And How To Permanently Eliminate It From Your Trading
  • The Four Stage Process To Make YOUR Trading Profitable And Predictable
Click Here to Register and Move the Needle in Your Trading

See you in the markets!
Brian McAboy
Trading Business Coach


Stock & ETF Trading Signals