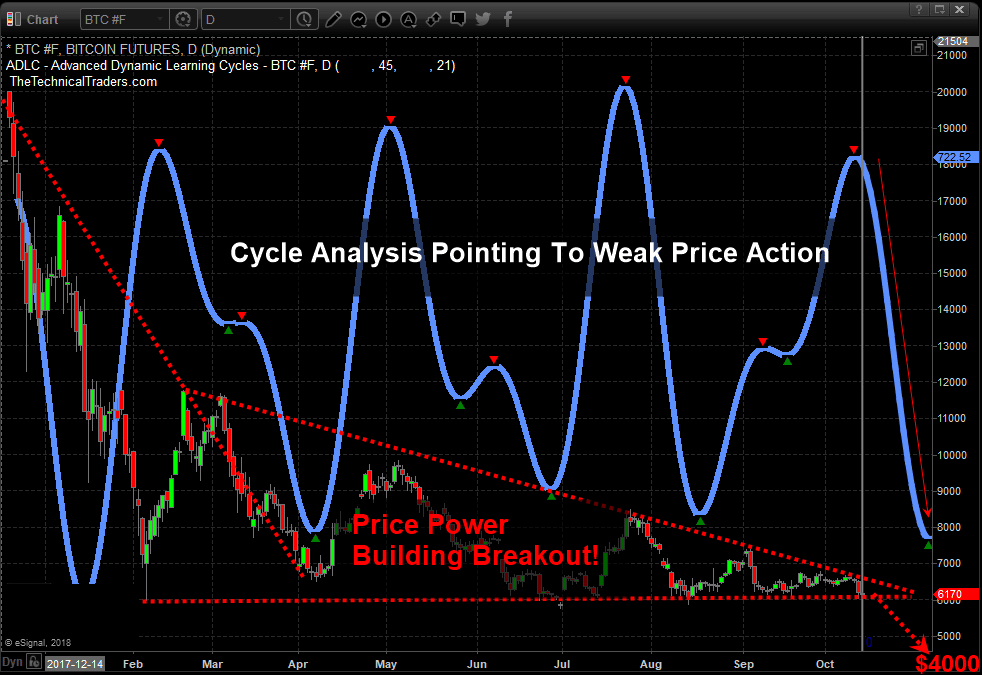
Recent market turmoil across the global stock markets has refocused investors on the concerns of global economics, trade, and geopolitical issues – away from cryptocurrencies. The biggest, Bitcoin, has been under extended pricing pressure recently and our research team believes Bitcoin will breach the $6000 level to the downside fairly quickly as extended global market downtrends continue.
The premise of our analysis is simple, the factors weighing on foreign investors and Bitcoin investors are that currencies are fluctuating wildly, local stock markets are declining and local economies may be contracting. All of this operates as a means for investors to turn to a “protectionism” stance where they attempt to protect capital/cash and attempt to limit downside risks.
The fact that Bitcoin has yet to break higher and has continued to fall under further pricing and adoption pressure means those investors that were hungry for the next great rally may be getting tired of waiting for this next move – if it ever happens. Our belief is that any downside pressure in Bitcoin below $5800 will likely push many crypto enthusiasts over the end and prompt them to sell out before prices attempt to move down further.
Our research team believes a deeper downside price rotation is setting up in Bitcoin that will push prices below the $5000 level before the end of this year. The uncertainty of the global equities markets are creating an environment where cryptos have simply lost their appeal. There has been no real substantial upside price move over the past 6+ months and the FLAG formation setting up is a very real warning sign that the eventual breakout move could be very dangerous.
Additionally, when we add our proprietary Advanced Learning Cycle system to the research, which points to much lower price rotation over the next 30+ days, we begin to see the very real possibility that Bitcoin could fall below $5000 very quickly and potentially target $4000 as an ultimate low.
As much as we would like to inform our followers that we believe Bitcoin will rally back to $18k fairly quickly, that is simply not the case. All of our indicators are suggesting that Bitcoin will fall to below $5000, and possibly towards $4000, before any real support is found. If you are a bitcoin believer, be aware that you may have a substantial opportunity to use your skills at this price swing plays out. Looking to buy back in near $4000 is much better than trying to hold for an additional $2000 loss.
Visit The Technical Traders to learn more about our research team and resources to help you become a better trader. Be prepared and build your skills to target greater success with our dedicated team. Read some of our other research to see for yourself how well we’ve been calling these recent market moves. Isn’t it time you invested in your future success?
Chris Vermeulen
Trade ideas, analysis and low risk set ups for commodities, Bitcoin, gold, silver, coffee, the indexes, options and your retirement. We'll help you keep your emotions out of your trading.
Showing posts with label Ethereum. Show all posts
Saturday, October 13, 2018
Why the Bitcoin Breakdown May Push Prices Below $5000
Labels:
Bitcoin,
BTC,
Chris Vermeulen,
cryptocurrency,
Ethereum,
Litecoin,
LTC. ETH,
Technical Traders
Friday, July 20, 2018
Bitcoin Rallies to Upper Channel - What Next?
Even we were concerned with Bitcoin briefly traded below $6k in late June. Yet, the recent upside price move was incredibly quick and the price of Bitcoin ran right up to our upper price channel. We believe this will become a new price peak over the next few days/weeks where the price of Bitcoin should continue to drop from these levels near $7500. We know there are many Bitcoin investors that want to hear us state that it should continue to push higher, but there are other factors at play here that may limit this movement.
The price channels that are currently constraining the price of Bitcoin originate back in February and March of 2018. The low and high price rotation within these months start the points of interest for our research team. From these points, we have continued to identify key price levels that appear to contain breakouts.
You can see from the chart below, the upper BLUE channel line is our downward sloping price channel that is acting like an upper ceiling for the price. Additionally, you can see our “drawn Red and Green arrows” showing what we believed Bitcoin would potentially do over the next few months. We believed that Bitcoin, as it traded lower, towards $6k, may find support and rally (based on our time/price cycles) towards a peak near July 16 (showing as the end of the Green Arrow). From this point, we believe the price of Bitcoin will trail off, heading lower, with the intent to retest channel support near $5700 if the price cannot break through and hold above the blue upper channel.
This longer term daily Bitcoin chart shows a larger picture of our analysis work. You can clearly see the channels that are constraining price at the moment – the BLUE support channel and the RED resistance channel. The most recent lows established a new lower price point for the Blue channel – which indicated a downward sloping pennant formation is in place.
There are two things we want to caution Bitcoin investors and traders about. First, the rotation that we are expecting to complete this pennant formation could happen very quickly within a fairly tight range ($7400 to $5700). For traders, this is an excellent range for some quick profits. For investors, this could create some stress as price rotates.
Second, by our estimates, at least one more low price rotation is required before any real breakout will be attempted. If our analysis is correct, this current price peak will end with prices falling back below $6k, forming another “lower bottom” and rallying again to near the upper price channel (near $6700 or so) before trailing off for the last time – nearing the apex of the pennant formation. We believe the current outcome of this price setup will be a low price breakout, forming a potential wave 5 that should end near or below $5500. After that bottom is reached, we should be looking for a new bottom formation setting up a new advancement leg higher.
Could our analysis change, of course, it could depending on what price action shows us. Right now, this pennant formation and the wave counts are driving our analysis. The Time/price cycle analysis helps us to determine when and where price target/peaks/troughs may happen, but they are not set in stone. If you are a trader and are long Bitcoin, this may be the highest price you will see over the next few months.
If you are an investor and think this is the start of a bigger move higher – we don’t agree with you. We believe we are very close to the final leg lower that should form the new price bottom – at least for a while. Once this bottom forms, we’ll be able to provide a better understanding of what we believe will happen in the future. For right now, our target low for the bottom is $4400 on or near August 20, 2018. We’ll see how it plays out.
We keep a close eye using our proprietary ADL Fibonacci and ADL Cycle forecasting systems using the Bitcoin investment trust which trades like a stock/ETF, the symbol is: GBTC.
If you want to learn how we can help you stay ahead of these global market moves and help you plan for and execute greater trades, please visit The Technical Traders site to learn how we assist you. We offer comprehensive research, analysis, daily video, trading signals and much more to our valued subscribers. We also offer access to our specialized proprietary price modeling systems that have proven to be timely and accurate.
Labels:
Bitcoin,
cryptocurrency,
Ethereum,
Litecoin
Sunday, January 7, 2018
Preparing for the Cryptocurrency Swan Event
Our trading partner Chris Vermeulen sent over this great article he put together covering how the current crypto markets volatility might affect the rest of the markets.
Many people have speculated that Cryptocurrencies can go to $10k or higher. Recently, the Chinese government has stepped up policy to regulate and eliminate Crypto ICOs as a means of increased speculation and gray market capital. Additionally, Jamie Dimon, of JP Morgan, stated that Bitcoin is a fraud and that it would “blow up” (MSN > Bitcoin is a Fraud That Will Blow Up Says JP Morgan Boss). What is the truth and what should investors expect in the future? Well, here is my opinion on this topic.
Bitcoin is based on the Blockchain technology architecture. I believe this architecture will continue to be explored under the basis of an open, distributed ledger method of developing opportunities. This technology improvement will likely drive advancement in other sectors of the global market as security and accountability continue to increase. Yet, the growing pains of this technology will likely continue to drive some wild moves over the next few years.
It has been reported that Cryptocurrencies fell $23 Billion in value since the peak. This would put the total valuation of the Crypto market at about $117 Billion near the same peak. Consider for a moment that the Bernie Madoff scandal was near $65 Billion total. Could a Cryptocurrency based “Swan Event” create chaos in the global markets?
In comparison to more traditional investment instruments, the risk exposure of Cryptocurrencies seems somewhat limited. Yet consider this… Many global firms jumped onto the Blockchain bandwagon within the last 12~24 months. This is not just individual investors any longer, this is most of the global financial market.
DATE TIMELINE OF FIRST INVESTMENT INTO CRYPTOCURRENCIES
So, now our “Swan Event” has a bit of depth in terms of risk exposure and breadth in terms of global market reach. What would an extended decline in Cryptocurrency valuations do to these firms and to the confidence in the Cryptocurrency market?
Could a collapse “Swan Event” drive prices back to below $1000 (USD) or further? What would the outcome of such an event be like for the global markets? Would this type of move reflect into the global market as an advance or decline overall? And what would this mean to the bottom line of these financial firms that have invested capital, resources and client’s capital into these markets?
It is our believe that the global markets are, without a Cryptocurrency event, setting up for a potentially massive corrective move. The chart, below, clearly shows what we believe to be a Head-n-Shoulders pattern forming that will likely prompt a breakdown move near October 2017 or shortly thereafter.
We believe this global market correction will prompt selling in weaker instruments and drive a massive “rip your face off” rally in the metals. We believe this move has already started with the formation of the Head-n-Shoulders pattern in the US markets as well as the recent upside move in the metals. The Cryptocurrency “Swan Event” may be the catalyst event that is needed to put pressure on other market instruments (US and Global equities, RealEstate, Consumer confidence/spending and Metals).
U.S. CUSTOM INDEX....HEAD-N-SHOULDER FORMATION
METALS : START OF RIP YOUR FACE OFF RALLY
REAL ESTATE CORRECTION
Are you prepared for this move? Do you want to know what to expect and do you need help understanding these market dynamics? The markets are setting up for what could be one of the most explosive cycle event moves in nearly a decade and you need to be prepared. We offer our research to our clients at The Market Trend Forecast for far less than you would imagine. For less than $1 per day, you can have access to our advanced research and analytics, market trend forecasts and more. We keep you informed with our timely updates and research to help you understand how these markets are moving, where to find opportunities and how to protect your investments.
Our research team has over 30 years experience in the markets and have been trained by some of the best technicians that ever lived. Isn’t it time you invested in a team of dedicated market analysts that can help you protect your assets and find opportunities for an unbelievable subscription rate?
When you join, we’ll send your our Guide to understanding trading PDF booklet to help you understand our advanced analysis techniques and adaptive learning strategies. These are all part of our commitment to providing you the best analysis, research and understanding of the market’s dynamics as well as making sure you understand what we are delivering to you each week.
Don’t miss this next big move, the “Swan Event”....Timing is everything.
Visit The Technical Traders Right Here to see what we are offering you.
Chris Vermeulen
Just Getting Started Trading Cryptocurrency? Get $10.00 Worth of FREE Bitcoin Right Here
Labels:
Bitcoin,
Chris Vermeulen,
cryptocurrency,
Ethereum,
Gas,
gold,
ICO,
Litecoin,
Oil
Subscribe to:
Posts (Atom)