
Thursday, December 22, 2022
Why Gold And Oil Falling In Value Are A Bad Sign For 2023
Friday, December 16, 2022
Stock Indexes Rejected At Resistance Signal Another Correction

But if not, we could be in for a doozy of a bear market in the first half of 2023. This week we had more hawkish Fed talk on Wednesday, suggesting that rates will remain higher for a longer period of time....Continue Reading Here.
Monday, November 28, 2022
After This Holiday Rally, You Better Know When To Walk Away

We get a lot of questions about if the stock market has bottomed or if it is headed lower and how they can take advantage of the next Major market move. Over the next 6 to 12 months, I expect the market to have violent price swings that will either make or break your financial future. So let me show a handful of charts and show what I expect to unfold.
Let’s dive in....Continue Reading Here.
Sunday, October 2, 2022
Gold Starting Stage 4 Decline: What Does This Mean For Investors?

The passive buy and hold investor is becoming panicked, and we can see this in the stock market through the mass selling of utility stocks, dividend stocks, and bonds.
When the masses become fearful, they liquidate nearly all assets in their portfolios which is why we see the Big Blue chip stocks selling off along with precious metals.
As investors liquidate around the world, they focus on where their money can still be preserved. With most currencies falling in value, there is a flood toward the U.S. dollar index as the safety play....Continue Reading Here.
Tuesday, August 30, 2022
New Gold Apex Pattern - How Will The U.S. Fed Rate Decision Affect This?
My research shows a new Gold Apex pattern is set up for September 11th - 15th. Around September 11th or after, Gold will attempt to reach this new Apex level near $1766. This price pattern is important because the US Fed rate decision date is September 20th - 21st, and a host of economic data reporting comes out the week before the Fed decision.
My educated guess is Gold & Silver will begin a volatile breakout move, possibly rolling lower to retest support near $1672, before attempting to move higher as global fear starts to elevate. I believe the current lower support level is critical to understanding the opportunities in Gold. If the $1672 level is breached to the downside, it means that Gold has lost a critical support level and will likely trend lower....Continue Reading Here.
Thursday, August 18, 2022
Crude Oil Prices - Will They Hold Above Key Support Level Or Begin To Unwind?
Talk of a global recession may prompt a broad decline in crude oil prices as the excesses of the past 10+ years unwind. This unwinding process pushed to the forefront for traders and investors has been prompted by a massive inflationary expansion after the COVID-19 lock downs. How will it play out in the short term and long term?
We believe crude oil will contract as the initial reduction in demand associated with high priced gasoline and oil products and the threat of a global recession recede. This decline in crude oil prices is complicated as China/Asia economic and COVID crisis events continue to disrupt consumer discretionary income and asset valuation levels.....Continue Reading Here.
We believe crude oil will contract as the initial reduction in demand associated with high priced gasoline and oil products and the threat of a global recession recede. This decline in crude oil prices is complicated as China/Asia economic and COVID crisis events continue to disrupt consumer discretionary income and asset valuation levels.....Continue Reading Here.
Thursday, June 23, 2022
Crude Oil Breaks Downward – Rejecting The $120 Price Level

It appears Crude Oil has confirmed resistance near $120 and is devaluing as consumers pull away from traditional driving/spending habits while the Fed aggressively attempts to burst the inflation bubble. This type of contraction in Crude Oil is very similar to what happened in 2008-09 when the Global Financial Crisis (GFC) hit – Crude Oil collapsed more than -70% after IYC started trending lower in 2007....Continue Reading Here
Saturday, May 14, 2022
Trading Crude Oil With USO
Crude oil, like most commodities, is not priced as a single data point like a stock. Instead, commodities, like oil, trade via futures contracts. A futures contract is an agreement to buy or sell a particular commodity or security at a predetermined price at a specified time in the future. Futures contracts are standardized for quantity and quality specifications to facilitate trading on a futures exchange....Continue Reading Here.

Tuesday, April 12, 2022
Utilities Rising & Transporters Sinking - Sector Rotation Is Providing Clues

Commodities such as energy, grains, and precious metals have all experienced nice rallies. Price action also confirms money flow coming out of transports and into utilities....Continue Reading Here.
Tuesday, April 5, 2022
Waiting For GLD To Make New Highs - Gold Rally Is Still Intact

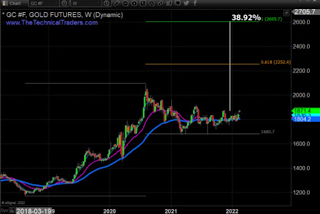
From late 2015 to August 2020, the price of gold doubled, going from approximately $1040 to $2080. Gold then experienced a profit taking $400 pullback. Gold’s rally over the past 12 months failed to break through its $2080 price level. After retreating back to $200, gold seems to have found support at the $1900 level.
In reviewing the following spot gold chart, it appears we have broken out of an accumulation phase and seem to be preparing to move above the $2080 high.....Continue Reading Here.
Thursday, March 10, 2022
How You Can Minimize Trading Risk & Grow Capital During A Global Crisis
- How long will the Russia – Ukraine war last?
- How high is the price of oil and gas going to go?
- How quickly will central banks raise interest rates to counter high inflation?
- What assets should I put my money into?
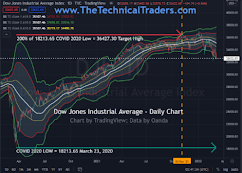
Knowing what the Best Asset Now (BAN) is, is critical for risk management and consistent growth no matter the market condition. Buy the Dip or Sell the Rally? Let's start here with the DJI weekly chart
Tuesday, February 15, 2022
Stocks Fall as Gold and Oil Jumps Amid Tension Over Ukraine - FED
We believe that the FED will make more rate hikes than they have announced. Goldman Sachs thinks there will be four 25-basis-point increases in the federal funds rate in 2022. Jamie Dimon, CEO of JPMorgan Chase, said, “he wouldn’t be surprised if there were even more interest rate hikes than that in 2022. There’s a pretty good chance there will be more than four. There could be six or seven. I grew up in a world where Paul Volcker raised his rates 200 basis points on a Saturday night.”
Mr. James Bullard of the St. Louis FED spoke out in an arrogant tone that aggressive action is now required. The markets translated this to mean that the FED was going to call an emergency meeting as soon as this coming week to hike interest rates by no less than 50 basis points. This sent interest rates soaring and stock prices plummeting.....Read More Here.
Saturday, January 29, 2022
Fed Comments Help To Settle Global Market Expectations
Additionally, the Fed has been telegraphing its intentions very clearly over the past few months, providing ample time for traders and investors to alter their approach to pending monetary tightening actions. Read the full Fed Statement here.
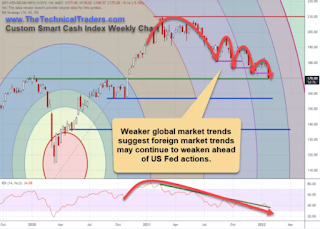
In my opinion, foreign markets are more likely to see increased risks and declining price trends for two reasons.
In my opinion, foreign markets are more likely to see increased risks and declining price trends for two reasons.
First, at risk nations/borrowers struggle to reduce debt levels.
Second, foreign market traders/investors struggle to adapt to the transition away from speculative “growth” trends.
I think the U.S. Dollar may continue to show strength over the next 4+ months as the foreign traders pile into U.S. economic strength while the Fed initiates their tightening actions.
So it makes sense to me that global markets would recoil from Fed tightening while debt-heavy corporations/nations seek relief from rising debt obligations....Continue Reading Here.
So it makes sense to me that global markets would recoil from Fed tightening while debt-heavy corporations/nations seek relief from rising debt obligations....Continue Reading Here.
Monday, January 17, 2022
Death, Taxes, and Time Decay
Few things are certain in life. But as the old saying goes, there is nothing quite so certain as “death and taxes”. As an Options Trader, I would enthusiastically add option time decay to that list.
Options offer traders and investors more leverage and risk mitigation than just purchasing shares outright. For example, if I were to purchase 100 shares of a stock at $100 per share, my total capital outlay would be $10,000. Options give us the right to buy or sell at a certain price for a pre-determined length of time.
I could control that same 100 shares by purchasing an "At the Money" call with a $100 strike price with 90 days to expiration for perhaps $6 per share, or $600 total capital outlay.
That’s powerful leverage. My downside risk is also limited to....Continue Reading Here.

Subscribe to:
Posts (Atom)
