Talk of a global recession may prompt a broad decline in crude oil prices as the excesses of the past 10+ years unwind. This unwinding process pushed to the forefront for traders and investors has been prompted by a massive inflationary expansion after the COVID-19 lock downs. How will it play out in the short term and long term?
We believe crude oil will contract as the initial reduction in demand associated with high priced gasoline and oil products and the threat of a global recession recede. This decline in crude oil prices is complicated as China/Asia economic and COVID crisis events continue to disrupt consumer discretionary income and asset valuation levels.....Continue Reading Here.
Showing posts with label Recession. Show all posts
Showing posts with label Recession. Show all posts
Thursday, August 18, 2022
Sunday, October 20, 2019
Revisiting Black Monday 1987
Back in the day, for those of you that are old enough to remember and have experienced one of the most incredible trader psychology driven stock market decline in recent history. The difference between “Black Monday” and most of the other recent stock market declines is that October 19, 1987, was driven by a true psychological panic, what we consider true price exploration, after an incredible price rally.
It is different than the DOT COM (2001) decline and vastly different than the Credit Market Crisis (2008-09) because both of those events were related to true fundamental and technical evaluations. In both of those instances, prices have been rising for quite some time, but the underlying fundamentals of the economics of the markets collapsed and the markets collapsed with future expectations. Before we get too deep, be sure to opt-in to our free market trend signals newsletter.
Our researchers believe the setup prior to the Black Monday collapse is strangely similar to the current setup across the global markets. In 1982, Ronald Reagan was elected into his second term as the US President. Since his election in 1980, the US stock market has risen over 300% by August 1987.
Reagan, much like President Trump, was elected after a long period of U.S. economic malaise and ushered in an economic boom cycle that really began to accelerate near August 1983 – near the end of his first term. The expansion from the lows of 1982, near 102.20, to the highs of 1987, near 337.90, in the S&P 500 prompted an incredible rally in the US markets for all global investors.

This is very similar to what has happened since 2015/16 in the markets and particularly after the November 2016 elections when the S&P500 bottomed near 1807.5 and has recently set hew highs near 3026.20 – a 67.4% price rally in just over 3 years.
One can simply make the assumption that global investors poured capital in the US markets in 1983 to 1986 as the US markets entered a rally mode just like we suspect global investors have poured capital into the US markets after the 2016 US elections and have continued to seek value, safety, and returns in the US markets since. These incredible price rallies setup a very real potential for “true price exploration” when investors suddenly realize valuations may be out of control.
So, what actually happened on October 19th, 1987 that was different than the last few market collapse events and why is it so similar to what is happening today?
On October 19, 1987, a different set of circumstances took place. This was almost a perfect storm of sorts for the markets. The US markets had risen nearly 44% by August 1987 from the previous yearly close – a huge rally had taken place. Computer trading, which some people suspected may have been a reason for the price decline on October 19, was largely in its infancy.
Floor traders were running the show in New York and Chicago. The London markets closed early the Friday, October 16, because of a weather event that was taking place. The “setup” of these events may have played a roll in the liquidity issues that became evident on Black Monday and pushed the US markets down 22.61% by the end of trading.
The US markets had set up a top near 2,722 in early August 1987 after rising nearly 44% from the 1986 end of year closing price level of 1,895. The SPX rotated lower from this peak to set up a sideways price channel near 315 throughout the end of August and through most of September. On October 5, 1987, the SPX started a downward price move that attempted to test the lower support channel near 312. On October 12, one week later, the SPX broke below this support channel and closed at 298.10 (below the psychological 300 level). The very next weekend was October 17 & 18 – the weekend before Black Monday.

Sunday night, October 18, in the US, the Asian markets opened for trading and a price sell-off began taking place in Hong Kong. Because the London markets has closed early on the 16th due to the storm, by the time they opened the UK markets began tanking almost immediately. Early in the day on Monday, October 19, the FTSE100 had collapsed over 136 points.
Our researchers believe the declines in the US markets in early October 1987 set up a breakdown event that, once support was broken, prompted a collapse event where liquidity issues accelerated the price decline volatility – much like the “flash crash”. Global investors were unprepared for the scale and scope of the price decline event and panicked at the speed of the price collapse.
In fact, at the height of the 1987 crash, systemic problems (mostly solvency and brokerage house operations) continued to threaten a much larger financial market collapse. Within days of Black Monday, it became evident that margin accounts and solvency issues related to operating capital, large scale risks and continued fear that the markets may continue to collapse presented a very real problem for the US and for the world. Have we re-entered another Black Monday type of setup across the global markets?

As new economic data continues to suggest the global markets are economically contracting and stagnating, the US Federal Reserve has started buying assets again while the foreign central banks continue to push negative interest rates while attempting to spark any signs of real economic growth. The US stock market has continued to push higher – almost attempting new all-time highs again just recently. The US stock market is up nearly 68% over the past 3.5 years since Trump was elected and as of Friday, October 18, 2019, the US stock markets fell nearly 0.75% on economic fears.
In Part II of this article, we’ll explore the potential of another Black Monday type of setup that may be playing out before our very eyes right now in the US stock market.
As a technical analysis and trader since 1997, I have been through a few bull/bear market cycles. I believe I have a good pulse on the market and timing key turning points for both short term swing trading and long-term investment capital. The opportunities are massive/life changing if handled properly.
I urge you visit my ETF Wealth Building Newsletter and if you like what I offer, join me with the 1-year subscription to lock in the lowest rate possible and ride my coattails as I navigate these financial market and build wealth while others lose nearly everything they own during the next financial crisis.
Chris Vermeulen
The Technical Traders
Sunday, December 27, 2015
When Will They Bottom? Crude Oil, SP500, then ExxonMobil
A full blown bear market in energy resources and energy stocks has been underway since mid-2014. History shows that the price of crude oil typically bottoms before the broad stock market. And oil related stocks bottom at the same time or later than the broad market. The monthly chart below shows how oil bottoms several months before the stock market does. This provides us with some insight on when we should start to expect a bear market to end in the US stock market.
Many traders follow and trade shares of Exxon Mobil. And while the are big money maker I do feel their share price is going to underperform oil for some time. Based on my research XOM has acquired many new oil operations, which many require $70+ per barrel to be profitable. This has cost XOM a considerable amount of capital and is now left holding and operating business that are losing money with the current price of oil sub $40 per barrel.

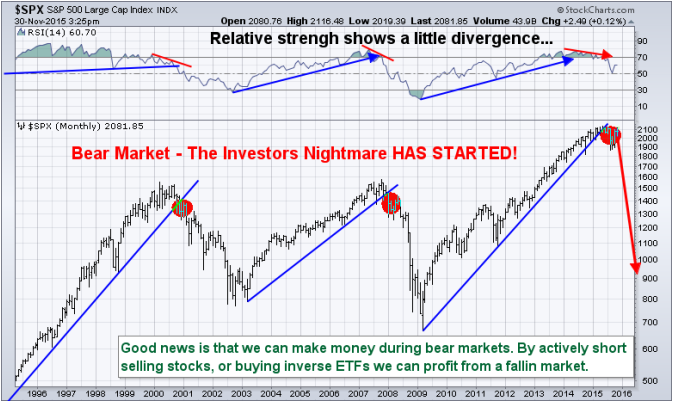
Base on my analysis, economic data and forecast I feel as though oil will remain low for another 3-9 months below $60 per barrel. It will do this for several reasons but what matter to us is that it forced the majority of oil producers to cap and close off well and go out of business. While this is taking place stocks and the economy will rebalance through a strong economic recession and a bear market in equities that will last most if not longer than 2016. Take a look at the US stock market average (SP500 index) in the chart below. While this chart is a very basic and simple looking forecast understand that the stock market internals and market breadth have completely collapsed just s we saw in 2000 and again in 2008 months before the index collapsed and started bear markets.

Oil, XOM, and Stock Trading Conclusion:
In short, I expect oil to find a bottom during the next 1-3 months. Oil services stocks on average are likely to trade sideways and build a basing pattern. These oil services stocks will not breakout and rally until the broad stock market has bottomed which I expect to happen late in 2016 or early 2017. Unfortunately, oil and oil stocks collapsed so fast without any retest or pause for us to get short and enjoy the ride down for profits. I feel trading oil and oil stocks will be choppy and tough in the near year. Last week subscribers and I played the energy (XLE) for a quick two-day pop of 2-4% return depending on entry and exit. These types of plays will continue, but the big trend trade in oil and energy are a long way away yet.
The easier money will be likely be shorting the stock market (buying inverse ETFs) to profit as stocks collapse which is what I provide subscribers to my ETF trade alert newsletter.
Chris Vermeulen – www.The Gold & Oil Guy.com
Get our latest FREE eBook "Understanding Options"....Just Click Here!
Tuesday, October 6, 2015
Recession Watch
By John Mauldin
“Growth is never by mere chance; it is the result of forces working together.”– J.C. Penney
“Strength and growth come only through continuous effort and struggle.”– Napoleon Hill
“We’re lost, but we’re making good time.”– Yogi Berra
I think it’s pretty much a given that we’re in for a cyclical bear market in the coming quarters. The question is, will it be 1998 or 2001/2007? Will the recovery look V shaped, or will it drag out? Remember, there is always a recovery. But at the same time, there is always a recession out in front of us; and that fact of life is what makes for long and difficult recoveries, not to mention very deep bear markets.
The problem is that our most reliable indicator for a recession is no longer available to us. The Federal Reserve did a study, which has been replicated. They looked at 26 indicators with regard to their reliability in predicting a recession. There was only one that was accurate all the time, and that was an inverted yield curve of a particular length and depth. Interestingly, it worked almost a year in advance. The inverted yield curve indicator worked very well the last two recessions; but now, with the Federal Reserve holding interest rates at the zero bound, it is simply impossible to get a negative yield curve.
Understand, an inverted yield curve does not cause a recession. It is simply an indicator that an economy is under stress. So now we are in an environment where we can look only at “predictive” indicators that are not 100% reliable. Actually, most are not even close. Some indicators have predicted seven out of the last four recessions. Some never trigger at all.
Recession Watch
All that said, looking at data from the last few weeks suggests that we need to be on “recession watch.” Global GDP is clearly slowing down, and the data we are getting from the US suggests that we are going to see a serious falloff in GDP over the next few quarters. I want to look at the recent (very disappointing) employment numbers, earnings forecasts (and some funny accounting), credit spreads, total leverage in the system, and the overall environment where credit, which has been the fuel for growth, is under pressure. The totality of this data says that we have to be on alert for a recession, because a recession will mean a full-blown bear market (down at least 40%), rising unemployment, and (sadly) QE4.
The jobs report on Friday was just ugly. Private payrolls increased by just 118,000, which is about the minimum level needed for unemployment not to rise. Government payrolls added 24,000. There were serious downward revisions to the last two months, as well. August was taken down by 37,000 jobs, and July was reduced by 22,000. The last three months have averaged just 167,000 new jobs compared to 231,000 for the previous three months and 260,000 for the six months prior to that.
My friend David Rosenberg dug a little deeper into the numbers and noted: Adding insult to injury and revealing an even softer underbelly to this report was the contraction in the workweek to 34.5 hours from 34.6 hours in August, which is effectively equivalent to an added 348,000 job losses.
So take the headline number, tack on the downward revisions and the loss of labour input from the decline in the workweek, and the "real" payroll number was [a minus] 265,000. You read that right.
While the unemployment rate remained at 5.1%, it did so largely because of a significant drop in the labor participation rate, which is not a good way to enhance employment. Further, the U-6 unemployment number is still a rather depressing 10%. Those are the people who are working part-time but would like full time jobs, as well as discouraged and marginally attached workers. Very few part-time jobs pay enough to finance a middle class lifestyle.
Earnings Recession
Leo Kolivakis of Pension Pulse has a downbeat earnings season preview, aptly titled “A Looming Catastrophe Ahead?”
Analysts have been steadily cutting 3Q earnings projections, and those revisions threaten to make some richly priced stocks even more so. Thomson Reuters data shows analysts expect a 3.9% year over year decline in S&P 500 earnings. Expectations are falling for future quarters as well.
These expectations have some strategists talking about an “earnings recession.” Just as an economic recession is two consecutive quarters of falling GDP, an earnings recession is two consecutive quarters of falling corporate profits.
The headwinds are no mystery. China’s weaker import demand is hurting all kinds of companies, especially raw materials and infrastructure suppliers. Caterpillar (CAT) slashed its revenue forecast and announced 10,000 job cuts. That probably isn’t playing well in Peoria. Accompanying the falloff in Chinese demand is an increase in the number of containers coming into the US as the strong dollar allows us to buy more and sell less. Not a particularly useful combination.
I love this quote from a Reuters story: “How can we drive the market higher when all of these signals aren’t showing a lot of prosperity?” said Daniel Morgan, senior portfolio manager at Synovus Trust Company in Atlanta, Georgia, who cited earnings growth as one of the drivers of the market. As we all know, it is every portfolio manager’s job to “drive the market higher.” Daniel evidently wants to do his part.
Sadly, despite our best efforts, the stock market faces an uphill climb. More from Reuters: Even with the recent selloff, stocks are still expensive by some gauges. The S&P 500 Index is selling at roughly 16 times its expected earnings for the next 12 months, lower than this year's peak of 17.8 but higher than the historic mean of about 15. The index would have to drop to about 1,800 to bring valuations back to the long-term range. The S&P 500 closed at 1,931.34 on Friday [Sept 25].
Moreover, forward and trailing price-to-earnings ratios for the S&P 500 are converging, another sign of collapsing growth expectations. The trailing P/E stands at about 16.5, Thomson Reuters data shows. Last year at this time, the forward P/E was also 16 but the trailing was 17.6.
The last period of convergence was in 2009 when earnings were declining following the financial crisis. The Energy sector is the biggest drag on earnings, meaning that we now see analysts everywhere calculating estimates “ex energy.” I suppose this produces useful information, but if we are going to exclude the bottom outlier, shouldn’t we exclude the top outlier as well? Healthcare is carrying much of the earnings burden for S&P 500 stocks, but I have yet to see an ex healthcare or ex energy & healthcare estimate. A funny thing about earnings: they’ve been going up for the past year, even as top line revenue has not. Generally, those go hand in hand. What’s happening?
And for the answer I have a story. A few years ago I made an assumption as to how a new stream of income would be taxed. I made that assumption based on my knowledge of having had similar income in the ’80s and ’90s. It turned out the rules had changed, and I hit the end of the year owing what was for me a rather large sum, as I was also trying to finance and build my new apartment.
I told my tale of woe to my accountant, Darrell Cain, who obviously detected the distress in my voice. He smiled at me and said, “John, I have an elephant bullet.” He reached under the table and pulled out an imaginary elephant bullet. “This is a big bullet. But I only have one of them. Once you use this bullet you can never use it again. If another elephant comes down the road, there will be nothing you can do.”
And yes, there were some one time tax maneuvers that reduced my taxes to a manageable number. But as he said, those were a one time option.
There is no way to prove it, but I think corporate accountants have been using up their elephant bullets this past year, as corporations want to be able to maintain the fiction that earnings are rising, so that price to earnings ratios don’t come under stress and cause stock prices to fall. You can move expenses from quarter to quarter, put off certain spending, recharacterize certain expenses one time, and so on. I deeply suspect we are going to find that some recent corporate earnings have been of the smoke and mirrors type.
Further, as I’ve written in previous letters, earnings forecasts are notoriously trend-following and typically miss the turns. If earnings are beginning to fall – and it appears they are – it is highly likely that earnings estimates will miss to the downside. If we slide into a recession at the same time, they will miss to the downside rather dramatically.
Is GDP Flatlining?
The Commerce Department will release its first estimate for 3Q US GDP on Thursday, Oct. 29. By then we will be in the thick of earnings season and will already know how many companies performed.
In the big picture, income (corporate or individual) can’t grow unless the economy grows. GDP may be a flawed way to measure economic growth, but it is the best tool we have. Blue chip estimates right now are that it ran at near a 2.5% annualized growth rate last quarter. However, the Atlanta Fed has sharply revised their GDP estimate for the third quarter down to under 1%. (See chart below.)
Will economic growth come into harmony with income growth? We know they have to meet eventually. At present, it appears GDP will stay in slow growth mode. That means it probably won’t be able to pull earnings up with it.

High-Yield – Rising Defaults
High yield spreads have been tightening and interest rates have been rising for some time. This is starting to cause some distress in the high yield (otherwise known as junk bond) market. My friend Steve Blumenthal has been following and timing the high yield market for 20 years. He recently wrote the following, which I’m going to blatantly cut and paste as it clearly depicts the level of distress in the high yield market.
If credit becomes more difficult to get, then growth is going to come under stress as well. I note that corporations that I think of as issuing higher quality debt are paying 10%. Thank you very much. Ten percent interest rates don’t seem to me to be very low.
To continue reading this article from Thoughts from the Frontline – a free weekly publication by John Mauldin, renowned financial expert, best selling author, and Chairman of Mauldin Economics – please click here.
The article Thoughts from the Frontline: Recession Watch was originally published at mauldineconomics.com.
Get our latest FREE eBook "Understanding Options"....Just Click Here!
Friday, August 28, 2015
A Correction Fireside Chat with the "10th Man"
By Jared Dillian
I don’t really enjoy these things like I used to. Keep in mind, I’ve traded through a lot of blowups, going back to 1997...1998...2001...2002-2003...2007-2009...2011...Today. They all kind of feel the same after a while.
Nobody wins from corrections except for the traders, which today mostly means computers. I forget who said this: “In bear markets, bulls lose money and bears lose money. Everyone loses money. The purpose of a bear market is to destroy capital.”....And that’s what is going on today.
For starters, long-term investors inevitably get sucked into the media MARKET TURMOIL spin cycle and puke their well-researched, treasured positions at the worst possible time. But I’m not trying to minimize the significance of a correction, because some corrections turn into bona fide bear markets. And if you are in a bear market, you should get out. If it is only a correction, you probably want to add to your holdings.
How can you tell the difference?
So what were the two big bear markets in the last 20 years? The dot com bust, and the global financial crisis. Two generational bear markets in a 10 year span. Hopefully something we’ll never see again. In one case, we had the biggest stock market bubble ever and in the other, the biggest housing/debt crisis ever.
Both good reasons for a bear market.
What are we selling off for again? Something wrong with China?
Again, not to minimize what is going on in China, because it is now the world’s second-largest economy. Forget the GDP statistics. After a decade of ridiculous overinvestment, it is possible that they’re on the cusp of a very serious recession, whether they admit it or not. But the good news is that the yuan is strong and can weaken a lot, and interest rates are high and can come down a lot. China has a lot of policy tools it can use (unlike the United States).
Let’s think about these “minor” corrections over the last 20 years.....
1997: Asian Financial Crisis
1998: Russia/Long-Term Capital Management (LTCM)
2001: 9/11
2011: Greece
All of these were VIX 40+ events.

In retrospect, these “crises” look kind of silly, even junior varsity. The Thai baht broke—big deal.
Russia’s debt default was only a problem because it was a surprise. And the amount of money LTCM was down—about $7 billion—is peanuts by today’s standards. After 9/11, stocks were down 20% in a week. The ultimate buying opportunity.
And in hindsight, we can see that the market greatly underestimated the ECB’s commitment to the euro.
So what are we going to say when we look back at this correction in 10-20 years? What will we name it? Will we call it the China crisis? I mean, if it’s a VIX 40 event, it needs a name.
I try to have what I call forward hindsight. Like, I pretend it’s the future and I’m looking back at the present as if it were the past. My guess is that we will think this was pretty stupid.
I saw a sell-side research note yesterday suggesting that this crisis is marking the capitulation bottom in emerging markets. I haven’t fully evaluated that statement, but I have a hunch that it is correct. China is cheap, by the way. But if China is too scary, they are just giving away India. I literally cannot buy enough. And I have a hunch that Brazil’s president, Dilma Rousseff, is going to be impeached and the situation in Brazil is going to improve relatively soon.
Think about it. The most contrarian trade on the board. Long the big, old, bloated, corrupt, ugly, bear market BRICs. Also the scariest trade. But the scary trades are often the good trades. There’s more. If you think we’re in the midst of a generational health care/biotech bull market, prices are a lot more attractive today than they were a few weeks ago. I also like gold here because central banks are no longer omnipotent.
That reminds me—there was something I wanted to say on China. The reason everyone hates China isn’t because of the economic situation. It’s because they made complete fools of themselves trying to prop up the stock market. So virtually overnight, we went from “China can do anything” to “China is full of incompetent idiots.” Zero confidence in the authorities.
You want to know when this crisis is going to end? When China manages to restore confidence. When they have that “whatever it takes” moment, like Draghi. If they keep easing monetary policy, sooner or later there will be an effect.
I used to get all revved up about this stuff. That’s when I made my living timing tops and bottoms. I don’t do that anymore. I do fundamental work, and I go to the gym and play racquetball. The mark-to-market is a nuisance. Also, if you can’t get excited about a VIX 50 event, you have probably been trading for too long.
There is a silver lining. The disaster scenario, where the credit markets collapse due to lack of liquidity, isn’t happening. Everyone is hiding and too scared to trade.
Honestly, high-grade credit isn’t acting all that bad. And it shouldn’t. I don’t see any big changes in the default rate. Anyway, if you want to go be a hero and bid with both hands, be my guest. It’s best to be careful and average into stuff. These prices will look pretty good a couple of months from now, I think.

Jared Dillian
If you enjoyed Jared's article, you can sign up for The 10th Man, a free weekly letter, at mauldineconomics.com. Follow Jared on Twitter @dailydirtnap
Nobody wins from corrections except for the traders, which today mostly means computers. I forget who said this: “In bear markets, bulls lose money and bears lose money. Everyone loses money. The purpose of a bear market is to destroy capital.”....And that’s what is going on today.
For starters, long-term investors inevitably get sucked into the media MARKET TURMOIL spin cycle and puke their well-researched, treasured positions at the worst possible time. But I’m not trying to minimize the significance of a correction, because some corrections turn into bona fide bear markets. And if you are in a bear market, you should get out. If it is only a correction, you probably want to add to your holdings.
How can you tell the difference?
My Opinion: This Is a Correction
Both good reasons for a bear market.
What are we selling off for again? Something wrong with China?
Again, not to minimize what is going on in China, because it is now the world’s second-largest economy. Forget the GDP statistics. After a decade of ridiculous overinvestment, it is possible that they’re on the cusp of a very serious recession, whether they admit it or not. But the good news is that the yuan is strong and can weaken a lot, and interest rates are high and can come down a lot. China has a lot of policy tools it can use (unlike the United States).
Let’s think about these “minor” corrections over the last 20 years.....
1997: Asian Financial Crisis
1998: Russia/Long-Term Capital Management (LTCM)
2001: 9/11
2011: Greece
All of these were VIX 40+ events.
In retrospect, these “crises” look kind of silly, even junior varsity. The Thai baht broke—big deal.
Russia’s debt default was only a problem because it was a surprise. And the amount of money LTCM was down—about $7 billion—is peanuts by today’s standards. After 9/11, stocks were down 20% in a week. The ultimate buying opportunity.
And in hindsight, we can see that the market greatly underestimated the ECB’s commitment to the euro.
So what are we going to say when we look back at this correction in 10-20 years? What will we name it? Will we call it the China crisis? I mean, if it’s a VIX 40 event, it needs a name.
I try to have what I call forward hindsight. Like, I pretend it’s the future and I’m looking back at the present as if it were the past. My guess is that we will think this was pretty stupid.
What to Buy
I saw a sell-side research note yesterday suggesting that this crisis is marking the capitulation bottom in emerging markets. I haven’t fully evaluated that statement, but I have a hunch that it is correct. China is cheap, by the way. But if China is too scary, they are just giving away India. I literally cannot buy enough. And I have a hunch that Brazil’s president, Dilma Rousseff, is going to be impeached and the situation in Brazil is going to improve relatively soon.
Think about it. The most contrarian trade on the board. Long the big, old, bloated, corrupt, ugly, bear market BRICs. Also the scariest trade. But the scary trades are often the good trades. There’s more. If you think we’re in the midst of a generational health care/biotech bull market, prices are a lot more attractive today than they were a few weeks ago. I also like gold here because central banks are no longer omnipotent.
That reminds me—there was something I wanted to say on China. The reason everyone hates China isn’t because of the economic situation. It’s because they made complete fools of themselves trying to prop up the stock market. So virtually overnight, we went from “China can do anything” to “China is full of incompetent idiots.” Zero confidence in the authorities.
You want to know when this crisis is going to end? When China manages to restore confidence. When they have that “whatever it takes” moment, like Draghi. If they keep easing monetary policy, sooner or later there will be an effect.
I Am Bored
I used to get all revved up about this stuff. That’s when I made my living timing tops and bottoms. I don’t do that anymore. I do fundamental work, and I go to the gym and play racquetball. The mark-to-market is a nuisance. Also, if you can’t get excited about a VIX 50 event, you have probably been trading for too long.
There is a silver lining. The disaster scenario, where the credit markets collapse due to lack of liquidity, isn’t happening. Everyone is hiding and too scared to trade.
Honestly, high-grade credit isn’t acting all that bad. And it shouldn’t. I don’t see any big changes in the default rate. Anyway, if you want to go be a hero and bid with both hands, be my guest. It’s best to be careful and average into stuff. These prices will look pretty good a couple of months from now, I think.
Jared Dillian
If you enjoyed Jared's article, you can sign up for The 10th Man, a free weekly letter, at mauldineconomics.com. Follow Jared on Twitter @dailydirtnap
The article The 10th Man: A Correction Fireside Chat was originally published at mauldineconomics.com.
Get our latest FREE eBook "Understanding Options"....Just Click Here!
Monday, July 13, 2015
It’s Not Over Until the Fat Lady Goes on a P/E Diet

By John Mauldin
For the vast majority of investors, portfolio returns are generated by the equity markets or at a minimum heavily influenced by the equity markets. We have enjoyed an almost six year bull market run in the stock market, which has helped heal portfolios after the devastating market crash of the Great Recession. So much so that many prominent market analysts have proclaimed the beginning of a new secular bull market.
If we have indeed entered such a new phase, we need to recognize it for what it is, because – as I’ve written for 17 years – the style of investing that is appropriate for a secular bull market is almost the exact opposite of what is appropriate for a secular bear market. I think that most analysts would agree with that last statement.
The disagreements would revolve around whether we are in a secular bull or a secular bear market.
Thus the answer to the seemingly arcane question of whether we are in a secular bull or bear market makes a great difference in the proper positioning of your portfolios. And getting it wrong can have serious consequences.
Towards the latter part of the ’90s and especially in the early part of last decade, I was rather aggressively asserting in this letter that we should look at whether we are in a secular bull or bear market – not in terms of price but in terms of valuation. Early in that period, Ed Easterling of Crestmont Research, who was then based in Dallas, reached out to me; and we began to collaborate on a series of articles on the topic of secular bull and bear markets, a series that we want to continue today. Longtime readers know that I’m a big fan of Ed’s website at www.CrestmontResearch.com. It’s a treasure trove of fabulous charts and data on cycles and market returns. Ed has been working on a video series (we will offer a few free links below) to explain market cycles.
I want to provide a little current context before we jump into the argument about whether we are in a secular bull or bear market. For some time now, I’ve been saying that the US economy should bump along in the Muddle Through range of about 2% GDP growth. The risk to that forecast is not from something internal to the United States but from what economists call an exogenous shock, that is, one from outside the US. In particular I have said that a crisis in both Europe and China at the same time would be very negative for both US and global growth.
We now see potential crises in both regions. It would be convenient if they could arrange not to have them at the same time. But those who are paying attention to global markets are certainly experiencing a bit of market heartburn as they watch both China and Europe manifest the volatility that they have over the last few weeks. I will become far less sanguine about the US economy if full blown crises develop in those two regions.
There are observers who think the Greek crisis will be contained, and then there are equally astute but pessimistic observers, like Ambrose Evans-Pritchard, who wrote this week about the potential for a full-scale European meltdown. His recent column entitled “Europe Is Blowing Itself Apart over Greece – and Nobody Seems Able to Stop It” is reflective of those who think the European monetary experiment is problematic. It now appears that Tsipras has essentially caved on a number of issues in order to get a deal. The deal he has proposed reads almost exactly like the one the Greek referendum overwhelmingly rejected.
My own personal view is that, if this deal is agreed upon, it simply postpones the crisis for a period of time, as Greece simply has no way to grow itself out of its debt dilemma. And it is not altogether clear that Tsipras can hold his coalition together, given the referendum. He might actually need the opposition to get this deal passed, which becomes problematical for him, as it might force him to call an election. But the banks would open, and Greek life would go on until the Greeks run out of money again in the sadly not too distant future, as there is no way on God’s green earth they can meet the growth requirements that this deal demands.
The monetary union is an absurd creation based on political hopes, not economic reality. Politics can keep it together for longer than it should otherwise exist, but unless the entire southern periphery of Europe turns German in character, the peripheral nations are going to suffer under a monetary policy not designed for their economies. That ill-fitting economic straitjacket is going to mean slower growth and higher unemployment and fiscal instability. How long will they endure that? So far, a lot longer than I thought they could, 15 years ago.
China’s stock markets are having a meltdown, although there has been a rebound the last few days as the Chinese government has stepped in with the decision to destroy their markets in order to save them. My friend Art Cashin commented that it is amazing what you can do if you tell people that they will either buy stocks and make them go up or get executed. It certainly clarifies your trading position.
Further, the Chinese government basically created a rule which said that anybody who owns more than 5% of any particular equity issuance is not allowed to sell for the next six months. Neither are directors, supervisors, or senior management of any public company. The government has evidently pressured banks into creating a buying consortium. Historians who are familiar with the stock market crash of 1929 will see an interesting parallel, illustrated in the chart below (sent to me by my friend Murat Koprulu).

Hundreds of Chinese stocks have been taken off the market because they are essentially locked limit down or because company management simply halted trading in their shares, as there seemed to be no bottom to the pricing. That is an interesting way to run a supposedly liquid equity market exchange. And it creates an overhang, in that, under the current rules of the exchange, those hundreds of stocks have to go back on the market within 30 days. Theoretically, they were falling in value, which was why they were taken off the market to begin with. Will their valuations somehow magically change?
I wonder if all the major indexing firms are happy with their recent decisions to include China as a major portion of their indexes, given that liquidity in their markets is available only when markets are going up. Just curious, but how in the Wide, Wide World of Sports do you price or even maintain an index if you can’t sell and have daily liquidity and price discovery? If 7% of your index is based on a valuation that is not real, what price do you then base daily liquidity on? The last trade? So the seller gets out at a price that might be significantly higher than what the issue would actually trade at? Who sues whom? Or maybe the issue then trades higher, not lower, so that the seller should have gotten more? Index fund managers have to be pulling their hair out over this one.
Is this collapse of the Chinese market just the result of irrational exuberance, or is there something more fundamental going on? We will have to watch the situation carefully in the coming weeks.
By the way, China is far more critical to the global economy than Greece is. So much so that I recently asked a number of my friends to give me their best thoughts on China. These are experts in markets, demographics, economics, geopolitics, and so on, all with specialties in China. I’ve compiled those thoughts along with my own and those of my co-author, Worth Wray, in an e-book called A Great Leap Forward? You can get it on Amazon, iTunes, and Nook for a mere $8.99. It is an easy read that will give you an understanding of China’s challenges, from the best China experts we could find. Now, let’s talk about where the market is going in the US.
Are We There Yet? Secular Stock Market Cycle Status
By John Mauldin and Ed Easterling
We were both talking about secular bear markets back in 1999 and 2000. It’s been 15 years. Aren’t we there yet? Isn’t the stock market rising?
Of course you’re getting impatient; so are we. When will the stock market shift from secular bear to secular bull – or did it already? The implications are significant. Through much of the 2000s and into the 2010s, individual and institutional investors have weathered quite a storm of low returns and high volatility. Are we done being battered? From today, can you reasonably expect above average secular bull returns like we saw in the 1980s and ’90s … or do we face another decade or longer of below average secular bear returns? [For a 3-minute video explaining the term secular, click this link.]
In short, we use secular to describe a particular valuation environment. If you use valuations as a tool for thinking about cycles, the cycles become much more clear and easily understandable. Simply using price gives you no objective criterion for determining where you are in a long term cycle. Within our longer term secular designations there can be numerous and significant cyclical bull and bear markets, which are determined by price and not valuations.
For years, analysts and pundits throughout the industry have agreed (though it took a number of years for many of them to come around) that the new millennium brought with it secular bear conditions. In the past few years, however, opinions have once again diverged. Notable heavyweights, including Guggenheim Investments, Raymond James, and BofA Merrill Lynch, are on the record that the stock market has now entered a long-term secular bull market. (They are certainly not the only ones, but they do provide nifty charts that make it easy to analyze their thoughts.)
As shown in Figure 1, Guggenheim clearly marks the transition point between the end of the secular bear that got underway in January 2000 and the start of the new secular bull market. They place that transition point at December 2010, so that by their reckoning the secular bear lasted eleven years and produced near zero annualized returns. Then, according to Guggenheim, a new secular bull market was unleashed with New Year 2011.
Figure 1. Guggenheim Secular Bull Started January 2010

From today, can you reasonably expect above-average secular bull returns like we saw in the 1980s and ’90s … or another decade or more of below average secular bear returns? |
To continue reading this article from Thoughts from the Frontline – a free weekly publication by John Mauldin, renowned financial expert, best-selling author, and Chairman of Mauldin Economics – please click here.
The article Thoughts from the Frontline: It’s Not Over Till the Fat Lady Goes on a P/E Diet was originally published at mauldineconomics.com.
Get our latest FREE eBook "Understanding Options"....Just Click Here!
Tuesday, December 16, 2014
German Chancellor Merkel Won’t Let Ukraine Get in the Way of Business

By Marin Katusa, Chief Energy Investment Strategist
The Ukraine crisis has moderated for now, but it should have awakened the world to the new “great game” being played in Eastern Europe. Vladimir Putin is positioning Russia to control the global energy trade, knowing that he holds the trump card: Europe’s dependence on Russian oil and gas.This epic struggle between the US and Russia could change the very nature of the Euro-American trans Atlantic alliance, because Europe is going to have to choose sides.
The numbers in Putin’s OIL = POWER equation are only going to keep getting bigger as Russia’s control and output of energy continues to grow and as Europe’s supply from other sources dwindles—as I outline in my new book, The Colder War. Finland and Hungary get almost all their oil from Russia; Poland more than 75%; Sweden, the Czech Republic, and Belgium about 50%; Germany and the Netherlands, upward of 40%.
Cutting back on energy imports from Russia as a means of pressuring Moscow is hardly in the EU’s best interest.
Germany, the union’s de facto leader, has simply invested too much in its relationship with Putin to sever ties—which is why Chancellor Angela Merkel has blocked any serious sanctions against Russia, or NATO bases in Eastern Europe.
In fact, Germany is moving to normalize its relations with Russia, which means marginalizing the Ukrainian showdown. Ukraine is but a very small part of Moscow’s and Berlin’s plans for the 21st century. Though the U.S. desperately wants Germany to lean Westward, it has instead been pivoting East. It’s constructing an alliance that will ultimately elbow the US out of Eastern and Central Europe and consign it to the status of peripheral player. (The concept of the “pivot “ in geopolitics was advanced by the celebrated early 20th century English geographer Halford Mackinder with regard to Russia’s potential to dominate Europe and Asia because it forms a geographical bridge between the two.
Mackinder’s “Heartland Theory” argued that whoever controlled Eurasia would control the world. Such a far flung empire might come into being if Germany were to ally itself with Russia. It’s a doctrine that influenced geopolitical strategists through both World Wars and the Cold War. It was even embraced by the Nazis before Russia became an enemy. And it may still be relevant today—despite the historical animosities between the two countries. After all, the mutually beneficial alliance of a resource-hungry Germany with a resource-rich Russia is a logical one.)
Considering the deepening ties between Russia and Germany in recent years, the real motive for the US’s stoking of unrest in Ukraine may not have been to pull Ukraine out of Russia’s sphere of influence and into the West’s orbit—it may have been primarily intended to drive a wedge between Germany and Russia.
The US almost certainly views the growing trade between them—3,000 German companies have invested heavily in Russia—as a major geopolitical threat to NATO’s health. The much-publicized spying on German politicians by the US and the British—and Germany’s reciprocal surveillance—shows the level of mutual distrust that exists.
If sowing discord between Russia and Germany was America’s goal, the implementation of sanctions might look like mission accomplished. Appearances can be deceptive, though.
Behind the scenes, Germany and Russia maintain a cordial dialogue, made all the easier because Vladimir Putin and Angela Merkel get along well on a personal level. They’re so fluent in each other’s languages that they correct their interpreters. They often confer about the possibility of creating a stable, prosperous and secure Eurasian supercontinent.
Despite the sanctions, German and Russian businessmen are still busy forging closer ties. At a shindig in September for German businesses in the North-East and Russian companies from St. Petersburg, Gerhard Schröder—former German prime minister and president, and friend of Putin—urged his audience to continue to build their energy and raw-material partnership.
Schröder’s close personal relationship with Putin is no secret. He considers the Russian president to be a man of utmost trustworthiness, and his Social Democratic Party has always been wedded to Ostpolitik (German for “new Eastern policy”), which asserts that his country’s strategic interest is to bind Russia into an energy alliance with the EU.
Schröder would have us believe that they never talk politics. Yet in his capacity as chair of the shareholders’ committee of Gazprom’s Nord Stream—the pipeline laid on the Baltic seabed which links Germany directly to Russian gas—he continues to advocate for a German-Russian “agreement.”
That’s a viewpoint Merkel shares. In spite of her public criticism of Putin’s policy toward Ukraine, Merkel has gone out of her way to play down any thought of a new Cold War. She’s on the record as wanting Germany’s “close partnership” with Russia to continue—and she’s convinced it will in the not-so-distant future.
Though Merkel has rejected lifting sanctions against Russia and continues to publicly call on Putin to exert a moderating influence on pro-Russian Ukrainian separatists, it looks like Germany is seeking a reasonable way out. That makes sense, given the disproportionate economic price Germany is paying to keep up appearances of being a loyal US ally.
Politicians in Germany are alert to the potential damage an alienated Russia could inflict on German interests. Corporate Germany is getting the jitters as well, and there are a growing number of dissenting voices in that sector. And anti-American sentiment in Germany—which is reflected in the polls—is putting added pressure on Berlin to pursue a softer line rather than slavishly following Washington’s lead in this geopolitical conflict.
With the eurozone threatened by a triple dip recession, expect Germany and the EU to act in their own interests. Germany has too much invested in Russia to let Ukraine spoil its plans.
As you can see, there’s no greater force controlling the global energy trade today than Russia and Vladimir Putin. But if you understand his role in geopolitics as Marin Katusa does, you’ll know how he’s influencing the flow of the capital in the energy sector—and which companies and projects will benefit and which will lose out.
Of course, the situation is fluid, which is why Marin launched a brand new advisory dedicated to helping investors get out in front of the latest chess moves in this struggle and make a bundle in the process.
It’s called The Colder War Letter. And it’s the perfect complement to Marin’s New York Times best-seller, The Colder War, and the best way to navigate and profit in the fast changing new reality of the energy sector. When you sign up now, you’ll also receive a FREE copy of Marin’s book. Click here for all the details.
The article German Chancellor Merkel Won’t Let Ukraine Get in the Way of Business was originally published at casey research
Get our latest FREE eBook "Understanding Options"....Just Click Here!
Thursday, November 6, 2014
Mark Twain: History Doesn't Repeat itself....But it Does Rhyme. Gold, Vanderbilt and more
By John Mauldin
“The significant problems that we have created cannot be solved at the level of thinking we were at when we created them.”– Albert Einstein
“Generals are notorious for their tendency to ‘fight the last war’ – by using the strategies and tactics of the past to achieve victory in the present. Indeed, we all do this to some extent. Life's lessons are hard won, and we like to apply them – even when they don't apply. Sadly enough, fighting the last war is often a losing proposition. Conditions change. Objectives change. Strategies change. And you must change. If you don't, you lose.”– Dr. G. Terry Madonna and Dr. Michael Young
“Markets are perpetuating a serious error by acting on the belief that central bankers actually know what they are doing. They do not. Not because they are ill-intentioned but because they are human and subject to the limitations that apply to all human endeavors. If you want proof of their fallibility, simply look at their economic forecasts. Despite their efforts to do so, central banks can’t repeal the business cycle (though they can distort it). While the 2008 financial crisis should have taught them that lesson, it appears to have led them to precisely the opposite conclusion.
“There are limits to knowledge in every field, including the hard sciences, and economics is not a hard science; it is a social science whose knowledge is imprecise, and practitioners’ ability to predict the future is extremely limited. Fed officials are attempting to guide an extremely complex economy with tools of questionable utility, and markets are ignoring their warnings that their ability to manage a positive outcome is highly uncertain. Markets are confusing what they want to happen with what is likely to happen, a common psychological phenomenon. Investors who prosper in the long run will be those who acknowledge the severe limits of economic knowledge and the compelling evidence that trillions of dollars of QE and years of zero interest rates may have saved the system from immediate collapse five years ago but failed to produce sustained economic growth or long-term price stability.”– Michael Lewitt, The Credit Strategist, Nov. 1, 2014
It is something of a cliché to quote Mark Twain’s “History doesn’t repeat itself, but it does rhyme.” But it is an appropriate way to kick things off, since we are going to look at the “ancient” history of Mark Twain’s era, and specifically the Panic of 1873. That October saw the beginning of 65 months of recession (certainly longer than our generation’s own Great Recession), which inflicted massive pain on the country. The initial cause was government monetary intervention, but the crisis was deepened by soaring debt and deflation.
As we seek to understand what happened 141 years ago, we’ll revisit the phenomenon of October as a month of negative market surprises. It actually has its roots in the interplay between farming and banking.
The Panic of 1873
Shortly after the Civil War, which saw the enactment of federal fiat money (the “greenback” of that era, issued to finance the war), there was a federal law passed that required rural and agricultural banks to keep 25% of their deposits with certain certified national banks, which were based mainly in New York. The national banks were required to pay interest on those deposits, so they had to put the money out for loans. But because those deposits were “callable” at any time, there was a limit to the types of loans they could do, as long-term loans mismatched assets and liabilities.
The brokers of the New York Stock Exchange were considered an excellent target for such loans. They could use the proceeds of the loans as margin to buy stocks, either for their own trading or on behalf of their clients. As long as the stocks went up – or at the very least as long as the ultimate clients were liquid – there wasn’t a problem for the national banks. Money could be repatriated; or, if necessary, margins could be called in a day. But this was before the era of a central bank, so actual physical dollars (and other physical instruments) were involved as reserves, as was gold. Greenbacks could be used to buy gold, but at a rate that floated. The price of gold could fluctuate significantly from year to year, depending upon the availability of gold and the supply of greenbacks (and of course, market sentiment – which certainly rhymes with our own time).
The driver for October volatility was an annual cycle, an ebb and flow of dollars to and from these rural banks. In the fall when the harvest was ready, the country banks would recall their margin loans in order to pay farmers or loan to merchants to buy crops from farmers and ship them via the railroads. Money would then become tight on Wall Street as the national banks called their loans back in.
This cycle often caused extra volatility, depending on the shortness of loan capital. Margin rates could rise to as much as 1% per day! Of course, this would force speculators to sell their stocks or cover their shorts, but in general it could drive down prices and make margin calls more likely. This monetary tightening often sent stocks into a downward spiral – not unlike the downward pressure that present-day Fed tightening actions have exerted, but in a compressed period of time.
If there was enough leverage in the system, a cascade could result, with stocks dropping 20% very quickly. Since much of Wall Street was involved in railroads, and railroads were nothing if not leveraged loans and capital, falling asset prices would reduce the ability of investors in railroads to find the necessary capital for expansion and maintenance of operations.
This historical pattern no longer explains the present-day vulnerability of markets in October. Perhaps the phenomenon persists simply due to market lore and investor psychology. Like an amputee feeling a twinge in his lost limb, do we still sense the ghosts of crashes past?
(And once more with Mark Twain: “October. This is one of the peculiarly dangerous months to speculate in stocks. The others are July, January, September, April, November, May, March, June, December, August, and February.”)
It was in this fall environment that a young Jay Gould decided to manipulate the gold market in the autumn of 1873, creating a further squeeze on the dollar. Not only would he profit off a play in gold, but he thought the move would help him in his quest to take control of the Erie Railroad. Historian Charles R. Morris explains, in a fascinating book called The Tycoons
Gould’s mind ran in labyrinthine channels, and he turned to the gold markets as part of a strategy to improve Erie’s freights. Grain was America’s largest export in 1869. Merchants purchased grain from farmers on credit, shipped it overseas, and paid off the farmers when they received their remittances from abroad. Their debt to the farmers was in greenbacks, but their receipts from abroad came in gold, for the greenback was not legal tender overseas. It could take weeks, or even months, to complete a transaction, so the merchant was exposed to changes in the gold/greenback exchange rate during that time. If gold fell (or the greenback rose), the merchant’s gold proceeds might not cover his greenback debts.
The New York Gold Exchange was created to help merchants protect against that risk. Using the Exchange, a merchant could borrow gold when he made his contract, convert it to greenbacks, and pay off his suppliers right away. Then he would pay off the gold loan when his gold payment came in some weeks later; since it was gold for gold, exchange rates didn’t matter. To protect against default, the Exchange required full cash collateral to borrow gold. But that was an opening for speculations by clever traders like Gould. If a trader bought gold and then immediately lent it, he could finance his purchase with the cash collateral and thereby acquire large positions while using very little of his own cash.
[Note from JM: In the fall there was plenty of demand for gold and a shortage of greenbacks. It was the perfect time if you wanted to create a “corner” on gold.]
Gould reasoned that if he could force up the price of gold, he might improve the Erie’s freight revenues. If gold bought more greenbacks, greenback-priced wheat would look cheaper to overseas buyers, so exports, and freights, would rise. And because of the fledgling status of the new Gold Exchange, gold prices looked eminently manipulable, since only about $20 million in gold was usually available in New York. [Some of his partners in the conspiracy were skeptical because…] The Grant administration, which had just taken office in March, was sitting on $100 million in gold reserves. If gold started suddenly rising, it would hurt merchant importers, who could be expected to clamor for government gold sales.
But Gould plunged ahead with his gold buying, including rather sizable amounts for Corbin’s wife (Grant’s wife’s sister), such that each one-dollar rise in gold would generate $11,000 in profits. Corbin arranged further meetings with Grant and discouraged him from selling gold all throughout September.
Gould and his partners initiated a “corner” in the gold market. This was actually legal at the time, and the NY gold market was relatively small compared to the amount of capital it was possible for a large, well-organized cabal to command. True corners were devastating to bears, as they generally borrowed shares or gold to sell short, betting on the fall in price. Just as today, if the price falls too much, then the short seller can buy the stock back and take his losses. But if there is no stock to buy back, if someone has cornered the market, then losses can be severe. Which of course is what today we call a short squeeze.
The short position grew to some $200 million, most of it owed to Gould and his friends. But there was only $20 million worth of gold available to cover the short sales. That gold stock had been borrowed and borrowed and borrowed again. The price of gold rose as Gould’s cabal kept pressing their bet.
But Grant got wind of the move. His wife wrote her sister, demanding to know if the rumor of their involvement was true. Corbin panicked and told Gould he wanted out, with his $100,000+ of profits, of course. Gould promised him his profits if he would just keep quiet.
Then Gould began to unload all his gold positions, even as some of his partners kept right on buying. You have to keep up pretenses, of course. Gould was telling his partners to push the price up to 160, while he was selling through another set of partners.
It is a small irony that Gould also had a contact in the government in Washington (a Mr. Butterfield) who assured him that there was no move to sell gold from DC, even as that contact was personally selling all his gold as fast as he could. Whatever bad you could say about Gould (and there were lots of bad things you could say), his trading instincts were good. He sensed his contact was lying and doubled down on getting out of the trade. In the end, Gould didn’t make any money to speak of and in fact damaged his intention of getting control of the Erie Railroad that fall.
The attempted gold corner didn’t do much harm to the country in and of itself. But when President Grant decided to step in and sell gold, there was massive buying, which sucked a significant quantity of physical dollars out of the market and into the US Treasury at a time when dollars were short. This move was a clumsy precursor to the open-market operations of the Federal Reserve of today, except that those dollars were needed as margin collateral by brokerage companies. No less than 14 New York Stock Exchange brokerages went bankrupt within a few days, not including brokerages that dealt just in gold.
All this happened in the fall, when there were fewer physical dollars to be had.
The price of gold collapsed. Cornelius Vanderbilt, who was often at odds with Jay Gould, had to step into the market (literally – that is, physically, which was rare for him) in order to quell the panic and provide capital, a precursor to J.P. Morgan’s doing the same during the Panic of 1907.
While many today believe the Fed should never have been created, we have not lived through those periods of panics and crashes. And while I think the Fed now acts in ways that are inappropriate (how can 12 FOMC board members purport to fine-tune an economic cycle, let alone solve employment problems?), the one true and proper role of the Fed is to provide liquidity in time of a crisis.
“People Who Live Too Much on Credit”
At the end of the day, it was too much debt that was the problem in 1873. Cornelius Vanderbilt was quoted in the epic book The First Tycoon as saying (emphasis mine)
I’ll tell you what’s the matter – people undertake to do about four times as much business as they can legitimately undertake.… There are a great many worthless railroads started in this country without any means to carry them through. Respectable banking houses in New York, so called, make themselves agents for sale of the bonds of the railroads in question and give a kind of moral guarantee of their genuineness. The bonds soon reach Europe, and the markets of their commercial centres, from the character of the endorsers, are soon flooded with them.… When I have some money I buy railroad stock or something else, but I don’t buy on credit. I pay for what I get. People who live too much on credit generally get brought up with a round turn in the long run. The Wall Street averages ruin many a man there, and is like faro.”
But the damage was done. The problem of liquidity was created by too much debt, as Vanderbilt noted. That debt inflated assets, and when those assets fell in price, so did the net worth of the borrowers. Far too much debt had to be worked off, and the asset price crash precipitated a rather deep depression, leaving in its wake far greater devastation than the recent Great Recession did. It took many years for the deleveraging process to work out. Sound familiar?
To continue reading this article from Thoughts from the Frontline – a free weekly publication by John Mauldin, renowned financial expert, best-selling author, and Chairman of Mauldin Economics – please click here.
Important Disclosures
The article Thoughts from the Frontline: Rhyme and Reason was originally published at mauldin economics
Get our latest FREE eBook "Understanding Options"....Just Click Here!
Tuesday, October 14, 2014
Is this the "Sea Change" some have warned us about?
By John Mauldin
Did you feel the economic weather change this week? The shift was subtle, like fall tippy toeing in after a pleasant summer to surprise us, but I think we’ll look back and say this was the moment when that last grain of sand fell onto the sand pile, triggering many profound fingers of instability in a pile that has long been close to collapse. This is the grain of sand that sets off those long chains of volatility that have been gathering for the last five years, waiting to surprise us with the suddenness and violence of the avalanche they unleash.
I suppose the analogy sprang to mind as I stepped out onto my balcony this morning. Texas has been experiencing one of the most pleasant summers and incredibly wonderful falls in my memory. One of the conversations that seem to occur regularly among locals who have a few decades under their belts here, is just how truly remarkable the weather has been. So it was a bit of a surprise to step out and realize the air had turned brisk. In retrospect it shouldn’t have fazed me. The air has been turning brisk in Texas at some point in October for the six decades that my memory covers, and for quite a few additional millennia, I suspect.
But this week, as I worked through my ever-growing mountain of reading, I felt a similar awareness of a change in the economic climate. Like fall, I knew it was coming. In fact, I’ve been writing about it for years! But just as fall tells us that it’s time to get ready for winter, at least in more northerly climes, the portents of the moment suggest to me that it’s time to make sure our portfolios are ready for the change in season.
Sea Change
Shakespeare coined the marvelous term sea change in his play The Tempest. Modern day pundits are liable to apply the word to the relatively minor ebb and flow of events, but Shakespeare meant sea change as a truly transformative event, a metamorphosis of the very nature and substance of a man, by the sea.
In this week’s letter we’ll talk about the imminent arrival of a true financial sea change, the harbinger of which was some minor commentary this week about the economic climate. This letter is arriving to you a little later this week, as I had quite some difficulty writing it, because, while the signal event is rather easy to discuss, the follow on consequences are myriad and require more in-depth analysis than I’ve been able to bring to them on short notice. As I wrestled with what to write, I finally came to realize that this sea change is going to take multiple letters to properly describe. In fact, it might eventually take a book.
So, in a departure from my normal writing style, I am going to offer you a chapter by chapter outline for a book. As with all book outlines, it will be simply full of bones but without much meat on them, let alone dressed up with skin and clothing. I will probably even connect the bones in the wrong order and have to go back later and replace a leg bone with a rib, but that is what outlines are for. There is clearly enough content suggested by this outline to carry us through the next several months; and given the importance of the subject, I expect to explore it fully with you. Whether it actually becomes a book, I cannot yet say.
I should note that much of what follows has grown out of in depth conversations with my associate Worth Wray and our mutual friends. We’ve become convinced that the imbalances in the global economic system are such that the risks are high that another period of economic volatility like the Great Recession is not only likely but is now in the process of developing. While this time will be different in terms of its causes and symptoms (as all such stressful periods differ from each other in many ways), there will be a rhyme and a rhythm that feels all too familiar. That should actually be good news to most readers, as the last 14 years have taught us a little bit about living through periods of economic volatility. You will get to use those skills you learned the hard way.
This will not be the end of the world if you prepare properly. In fact, there will be plenty of opportunities to take advantage of the coming volatility. If the weatherman tells you winter is coming, is he a prophet of doom? Or is it reasonable counsel that maybe we should get our winter clothes out?
Three caveats before we get started. One, I am often wrong but seldom in doubt. And while I will marshal facts and graphs aplenty to reinforce my arguments, I would encourage you to think through the counter factuals presented by those who will aggressively disagree.
Two, while it goes without saying, you are responsible for your own decisions. It is easy for me to say that I think the bond market is going to go in a particular direction. I can even bet my personal portfolio on my beliefs. I can’t know your circumstances, but if you are similar to most investors, this is the time to make sure you have a truly balanced portfolio with serious risk management in the event of a sudden crisis.
Three, give me (and Worth, whom I am going to draft to write some letters) some time to develop the full range of our ideas. To follow on with my weather analogy, the air is just starting to get crisp, and winter is still a couple months away. Absent something extraordinary, we are not going to get snow and a blizzard in Dallas, Texas, tomorrow. We may still have some time to prepare, but at a minimum it is time to start your preparations. So with those caveats, let’s look at an outline for a potential book called Sea Change.
Prologue
I turned publicly bearish on gold in 1986. At the time (a former life in a galaxy far, far away), I was actually writing a newsletter on gold stocks and came to the conclusion that gold was going nowhere – and sold the letter. I was still bearish some 16 years later. Then, on March 1, 2002, I wrote in Thoughts from the Frontline that it was time to turn bullish on gold. Gold at that time was languishing around $300 an ounce, near its all time bottom.
What drove that call? I thought that the future directions of gold and the dollar were joined at the hip. A bit over a year later I laid out the case for a much weaker dollar in a letter entitled “King Dollar Meets the Guillotine,” which later became the basis for a chapter in Bull’s Eye Investing. As the chart below shows, the dollar had risen relentlessly through the early Reagan years, doubling in value against the currencies of America’s global neighbors, causing exporters to grumble about US dollar policy. Then the bottom fell out, as the dollar made new lows in 1992. From 1992 through 2002 the dollar recovered about half of its value, getting back to roughly where it was in 1967. Elsewhere about that time, I predicted that the euro, which was then at $0.88, would rise to $1.50 before falling back to parity over a very long period of time. I believe we are still on that journey.

One of the biggest drivers of economic fortunes in the global economy is the currency markets. The value of your trading currency affects every aspect of your business and investments. It is fundamental in nature. While most Americans never even see a piece of foreign currency, every time we walk into Walmart, we are subject to the ebb and flow of global currency valuations, as are Europeans and indeed every person who participates in the movement of goods and services around the globe. In fact, globalization means that currency values are more important than ever. The world is more tightly interconnected now than it has ever been, which means that events which previously had no effect upon global affairs can trigger cascades of events that affect everyone.
I believe we are in the early stages of a profound currency valuation sea change. I have lived through five major changes in the value of the dollar in the 45 years since Nixon closed the gold window. And while we are used to 40% to 50% moves in the stock market and other commodity prices happening in just a few years (or less), large movements in major trading currencies typically take many years, if not decades, to develop. I believe we are in the opening act of a multi-year US dollar bull market.
To continue reading this article from Thoughts from the Frontline – a free weekly publication by John Mauldin, renowned financial expert, best selling author, and Chairman of Mauldin Economics – please click here.
The article Thoughts from the Frontline: Sea Change was originally published at mauldin economics
Get our latest FREE eBook "Understanding Options"....Just Click Here!
Wednesday, July 16, 2014
Hoisington Investment Management: Quarterly Review and Outlook, Second Quarter 2014

By John Mauldin
This week’s Outside the Box is from an old friend to regular readers. It’s time for our Quarterly Review & Outlook from Lacy Hunt of Hoisington Investment Management, who leads off this month with a helpful explanation of the relationship between the U.S. GDP growth rate and 30 year treasury yields. That’s an important relationship, because long term interest rates above nominal GDP growth (as they are now) tend to retard economic activity and vice versa.
The author adds that the average four quarter growth rate of real GDP during the present recovery is 1.8%, well below the 4.2% average in all of the previous post war expansions; and despite six years of federal deficits totaling $6.27 trillion and another $3.63 trillion in quantitative easing by the Fed, the growth rate of the economy continues to erode.
So what gives? We’re simply too indebted, says Lacy; and too much of the debt is nonproductive. (Total U.S. public and private debt rose to 349.3% of GDP in the first quarter, up from 343.7% in the third quarter of 2013.) And as Hyman Minsky and Charles Kindleberger showed us, higher levels of debt slow economic growth when the debt is unbalanced toward the type of borrowing that doesn’t create an income stream sufficient to repay principal and interest.
And it’s not just the US. Lacy notes that the world’s largest economies have a higher total debt to GDP ratio today than at the onset of the Great Recession in 2008, and foreign households are living farther above their means than they were six years ago.
Simply put, the developed (and much of the developing) world is fast approaching the end of a 60-year-long debt supercycle, as I (hope I) conclusively demonstrated in Endgame and reaffirmed in Code Red.
Hoisington Investment Management Company (www.Hoisingtonmgt.com) is a registered investment advisor specializing in fixed income portfolios for large institutional clients. Located in Austin, Texas, the firm has over $5 billion under management and is the sub adviser of the Wasatch-Hoisington U.S. Treasury Fund (WHOSX).
Some readers may have noticed that there was no Thoughts from the Frontline in their inboxes this weekend. As has happened only once or twice in the last 14 years, I found myself in an intellectual cul-de-sac, and there was not enough time to back out. Knowing that I was going to be involved in a fascinating conference over the weekend, I had planned to do a rather simple analysis of a new book on how GDP is constructed. But as I got deeper into thinking about the topic and doing more research, I remembered something I read 20 years ago about the misleading nature of GDP, and I realized that a simple analysis just wouldn’t cut it.
Rather than write something that would’ve been inadequate and unsatisfying, I decided to just put it off till next week. Your time and attention are quite valuable, and I try not to waste them. But there will be no excuses this weekend.
The conference I attended was organized by Great Point Partners, a hedge fund and private equity firm focusing on medical and biotechnology. I really had not seen the program until I arrived and did not realize what a powerful lineup of industry leaders would be presenting on some of the latest technologies and research. The opportunity was too good to pass up, as it is so rare that any of us get to sit down with people who are responsible for the science we all read about.
I had breakfast with a small group of 11 readers/investors one morning and learned a lot by asking them what their favorite investing passion was. Although everyone had concerns, they all had areas in which they were quite bullish. I find that everywhere I go. It was interesting, in that they all expected me to be far more negative about things than I am. I guess when you write about macroeconomics as much as I do, and there’s as much wrong with it as there is, you kind of end up being labeled as a Gloomy Gus. I am actually quite optimistic about the long-term future of humanity, but I’ll admit there will be a few bumps along the way. Given how many bumps there have already been, just in my own lifetime, and given that we seem to have gotten through them, I can’t help but be optimistic that we’ll get through the next round.
It was a fascinating weekend, made all the more so by my very gracious hosts, Jeff Jay and David Kroin, Managing Directors of Great Point. They and their staff made sure I could enjoy my time on Nantucket Island. It was my first visit to the area, and I hope it won’t be the last.
Last night I had dinner with Art Cashin, Barry Ritholtz, Jack Rivkin, and Dan Greenhaus. It was a raucous, intellectually enlivening evening, and our conversation ranged from macroeconomics to our favorite new technologies. Jack Rivkin is involved with Idealab, and one of his favorites is that he sees the eventual end of Amazon as 3-D printing becomes more available. Given how Bezos has adapted over the years, I’m not so sure. Jack and Barry will join me in Maine in a few weeks, where we will again join the debate about bull and bear markets.
Now let’s go to Lacy and think about the intersection of velocity and money supply and what it says about future growth potential. I have two full days of meetings with my partners and others here in New York before I return to Dallas, and then I get to stay home for a few weeks. There are lots of new plans in the works. And lots of reading to do between meetings. Have a great week!
Your hoping to be able to stay optimistic analyst,

As chart one attests, interest rates below nominal GDP growth helps to accelerate economic activity and vice versa. Currently the higher interest rates are retarding economic growth, suggesting the next move in interest rates is lower.
To put the 2.9% change in nominal GDP over the past four quarters in perspective, it is below the entry point of any post-war recession. Even adjusting for inflation the average four-quarter growth rate in real GDP for this recovery is 1.8%, well below the 4.2% average in all of the previous post war expansions.
Readers of our letters are familiar with our long-standing assessment that the cause of slower growth is the overly indebted economy with too much non productive debt. Rather than repairing its balance sheet by reducing debt, the U.S. economy is starting to increase its leverage. Total debt rose to 349.3% of GDP in the first quarter, up from 343.7% in the third quarter of 2013.
It is possible to cast an increase in debt in positive terms since it suggests that banks and other financial intermediaries are now confident and are lowering credit standards for automobiles, home equity, credit cards and other types of loans. Indeed, the economy gets a temporary boost when participants become more indebted. This conclusion was the essence of the pioneering work by Eugen von Böhm-Bawerk (1851-1914) and Irving Fisher which stated that debt is an increase in current spending (economic expansion) followed by a decline in future spending (economic contraction).
In concert with this view, but pinpointing the negative aspect of debt, contemporary economic research has corroborated the views of Hyman Minsky (1919-1996) and Charles Kindleberger (1910-2003) that debt slows economic growth at higher levels when it is skewed toward the type of borrowing that will not create an income stream sufficient to repay principal and interest.
Scholarly studies using very sophisticated analytical procedures conducted in the U.S. and abroad document the deleterious effects of high debt ratios. However, the use of a balance sheet measure can be criticized in two ways. First, income plays a secondary role, and second, debt ratios are not an integral part of Keynesian economic theory.
We address these two objections by connecting the personal saving rate (PSR) which is at the core of Keynesian economic analysis, and the private debt to GDP ratio that emerges from non-Keynesian approaches. Our research indicates that both the “Non Keynesian” private debt to GDP ratios, as well as the “Keynesian” PSR, yield equivalent analytical conclusions.

The PSR and private debt to GDP ratio are, indeed, negatively correlated (Chart 2). The correlation should not, however, be perfect since the corporate sector is included in the private debt to GDP ratio while the PSR measures just the household sector. We used the total private sector debt ratio because the household data was not available in the years leading up to the Great Depression.
The most important conceptual point concerning the divergence of these two series relates to the matter of the forgiveness of debt by the financial sector, which will lower the private debt to GDP ratio but will not raise the PSR. The private debt to GDP ratio fell sharply from the end of the recession in mid-2009 until the fourth quarter of 2013, temporarily converging with a decline in the saving rate. As such, much of the perceived improvement in the consumer sector’s financial condition occurred from the efforts of others. The private debt to GDP ratio in the first quarter of 2014 stood at 275.4%, a drop of 52.5 percentage points below the peak during the recession. The PSR in the latest month was only 1.7 percentage points higher than in the worst month of the recession. Importantly, both measures now point in the direction of higher leverage, with the PSR showing a more significant deterioration. From the recession high of 8.1%, the PSR dropped to 4.8% in April 2014.

In Dr. Martha Olney’s (University of California, Berkeley and author of Buy Now, Pay Later) terminology, when the PSR falls households are buying now but will need to pay later. Contrarily, if the PSR rises households are improving their future purchasing power. A review of the historical record leads to two additional empirical conclusions. First, the trend in the PSR matters. A decline in the PSR when it has been falling for a prolonged period of time is more significant than a decline after it has risen. Second, the significance of any quarterly or annual PSR should be judged in terms of its long term average.
For example, multi-year declines occurred as the economy approached both the Great Recession of 2008 and the Great Depression of 1929. In 1925 the PSR was 9.2%, but by 1929 it had declined by almost half to 4.7%. The PSR offered an equal, and possibly even better, signal as to the excesses of the 1920s than did the private debt to GDP ratio. Both the level of PSR and the trend of its direction are significant meaningful inputs.
John Maynard Keynes (1883-1946) correctly argued that the severity of the Great Depression was due to under-consumption or over saving. What Keynes failed to note was that the under consumption of the 1930s was due to over spending in the second half of the 1920s. In other words, once circumstances have allowed the under saving event to occur, the net result will be a long period of economic under performance.
Keynes, along with his most famous American supporter, Alvin Hansen (1887-1975), argued that the U.S. economy would face something he termed “an under-employment equilibrium.” They believed the U.S. economy would return to the Great Depression after World War II ended unless the federal government ran large budget deficits to offset weakness in consumer spending. The PSR averaged 23% from 1942 through 1946, and the excessive indebtedness of the 1920s was reversed. Consumers had accumulated savings and were in a position to fuel the post WWII boom. The economy enjoyed great prosperity even though the budget deficit was virtually eliminated. The concerns about the under employment equilibrium were entirely wrong. In Keynes’ defense, the PSR statistics cited above were not known at the time but have been painstakingly created by archival scholars since then.
Japan confirms the experience in the United States because their PSR has declined from over 20% in the financial meltdown year of 1989 to today’s near zero level. Japan, unlike the U.S. in the 1940s, has moved further away from financial stability. Despite numerous monetary and fiscal policy maneuvers that were described as extremely powerful, the end result was that they have not been successful.

With U.S. rates higher than those of major foreign markets, investors are provided with an additional reason to look favorably on increased investments in the long end of the U.S. treasury market. Additionally, with nominal growth slowing in response to low saving and higher debt we expect that over the next several years U.S. thirty year bond yields could decline into the range of 1.7% to 2.3%, which is where the thirty year yields in the Japanese and German economies, respectively, currently stand.
Van R. Hoisington
Lacy H. Hunt, Ph.D.
Like Outside the Box?
Sign up today and get each new issue delivered free to your inbox.
It's your opportunity to get the news John Mauldin thinks matters most to your finances.
Important Disclosures
The author adds that the average four quarter growth rate of real GDP during the present recovery is 1.8%, well below the 4.2% average in all of the previous post war expansions; and despite six years of federal deficits totaling $6.27 trillion and another $3.63 trillion in quantitative easing by the Fed, the growth rate of the economy continues to erode.
So what gives? We’re simply too indebted, says Lacy; and too much of the debt is nonproductive. (Total U.S. public and private debt rose to 349.3% of GDP in the first quarter, up from 343.7% in the third quarter of 2013.) And as Hyman Minsky and Charles Kindleberger showed us, higher levels of debt slow economic growth when the debt is unbalanced toward the type of borrowing that doesn’t create an income stream sufficient to repay principal and interest.
And it’s not just the US. Lacy notes that the world’s largest economies have a higher total debt to GDP ratio today than at the onset of the Great Recession in 2008, and foreign households are living farther above their means than they were six years ago.
Simply put, the developed (and much of the developing) world is fast approaching the end of a 60-year-long debt supercycle, as I (hope I) conclusively demonstrated in Endgame and reaffirmed in Code Red.
Hoisington Investment Management Company (www.Hoisingtonmgt.com) is a registered investment advisor specializing in fixed income portfolios for large institutional clients. Located in Austin, Texas, the firm has over $5 billion under management and is the sub adviser of the Wasatch-Hoisington U.S. Treasury Fund (WHOSX).
Some readers may have noticed that there was no Thoughts from the Frontline in their inboxes this weekend. As has happened only once or twice in the last 14 years, I found myself in an intellectual cul-de-sac, and there was not enough time to back out. Knowing that I was going to be involved in a fascinating conference over the weekend, I had planned to do a rather simple analysis of a new book on how GDP is constructed. But as I got deeper into thinking about the topic and doing more research, I remembered something I read 20 years ago about the misleading nature of GDP, and I realized that a simple analysis just wouldn’t cut it.
Rather than write something that would’ve been inadequate and unsatisfying, I decided to just put it off till next week. Your time and attention are quite valuable, and I try not to waste them. But there will be no excuses this weekend.
The conference I attended was organized by Great Point Partners, a hedge fund and private equity firm focusing on medical and biotechnology. I really had not seen the program until I arrived and did not realize what a powerful lineup of industry leaders would be presenting on some of the latest technologies and research. The opportunity was too good to pass up, as it is so rare that any of us get to sit down with people who are responsible for the science we all read about.
I had breakfast with a small group of 11 readers/investors one morning and learned a lot by asking them what their favorite investing passion was. Although everyone had concerns, they all had areas in which they were quite bullish. I find that everywhere I go. It was interesting, in that they all expected me to be far more negative about things than I am. I guess when you write about macroeconomics as much as I do, and there’s as much wrong with it as there is, you kind of end up being labeled as a Gloomy Gus. I am actually quite optimistic about the long-term future of humanity, but I’ll admit there will be a few bumps along the way. Given how many bumps there have already been, just in my own lifetime, and given that we seem to have gotten through them, I can’t help but be optimistic that we’ll get through the next round.
It was a fascinating weekend, made all the more so by my very gracious hosts, Jeff Jay and David Kroin, Managing Directors of Great Point. They and their staff made sure I could enjoy my time on Nantucket Island. It was my first visit to the area, and I hope it won’t be the last.
Last night I had dinner with Art Cashin, Barry Ritholtz, Jack Rivkin, and Dan Greenhaus. It was a raucous, intellectually enlivening evening, and our conversation ranged from macroeconomics to our favorite new technologies. Jack Rivkin is involved with Idealab, and one of his favorites is that he sees the eventual end of Amazon as 3-D printing becomes more available. Given how Bezos has adapted over the years, I’m not so sure. Jack and Barry will join me in Maine in a few weeks, where we will again join the debate about bull and bear markets.
Now let’s go to Lacy and think about the intersection of velocity and money supply and what it says about future growth potential. I have two full days of meetings with my partners and others here in New York before I return to Dallas, and then I get to stay home for a few weeks. There are lots of new plans in the works. And lots of reading to do between meetings. Have a great week!
Your hoping to be able to stay optimistic analyst,
John Mauldin, Editor
Outside the Boxsubscribers@mauldineconomics.com
Outside the Boxsubscribers@mauldineconomics.com
Hoisington Investment Management – Quarterly Review and Outlook, Second Quarter 2014
Treasury Bonds Undervalued
Thirty year treasury bonds appear to be undervalued based on the tepid growth rate of the U.S. economy. The past four quarters have recorded a nominal “top line” GDP expansion of only 2.9%, while the bond yield remains close to 3.4%. Knut Wicksell (1851-1926) noted that the natural rate of interest, a level that does not tend to slow or accelerate economic activity, should approximate the growth rate of nominal GDP. Interest rates higher than the top line growth rate of the economy, which is the case today, would mean that resources from the income stream of the economy would be required to pay for the higher rate of interest, thus slowing the economy. Wicksell preferred to use, not a risk free rate of interest such as thirty year treasury bonds, but a business rate of interest such as BAA corporates.As chart one attests, interest rates below nominal GDP growth helps to accelerate economic activity and vice versa. Currently the higher interest rates are retarding economic growth, suggesting the next move in interest rates is lower.
To put the 2.9% change in nominal GDP over the past four quarters in perspective, it is below the entry point of any post-war recession. Even adjusting for inflation the average four-quarter growth rate in real GDP for this recovery is 1.8%, well below the 4.2% average in all of the previous post war expansions.
Fisher's Equation of Exchange
Slow nominal growth is not surprising to those who recall the American economist Irving Fisher’s (1867-1947) equation of exchange that was formulated in 1911. Fisher stated that nominal GDP is equal to money (M) times its turnover or velocity (V), i.e., GDP=M*V. Twelve months ago money (M) was expanding about 7%, and velocity (V) was declining at about a 4% annual rate. If you assume that those trends would remain in place then nominal GDP should have expanded at about 3% over the ensuing twelve months, which is exactly what occurred. Projecting further into 2014, the evidence of a continual lackluster expansion is clear. At the end of June money was expanding at slightly above a 6% annual rate, while velocity has been declining around 3%. Thus, Fisher’s formula suggests that another twelve months of a 3% nominal growth rate is more likely than not. With inflation widely expected to rise in the 1.5% to 2.0% range, arithmetic suggests that real GDP in 2014 will expand between 1.0% and 1.5% versus the average output level of 2013. This rate of expansion will translate into a year over year growth rate of around 1% by the fourth quarter of 2014. This is akin to pre-recessionary conditions.
An Alternative View of Debt
The perplexing fact is that the growth rate of the economy continues to erode despite six years of cumulative deficits totaling $6.27 trillion and the Federal Reserve’s quantitative easing policy which added net $3.63 trillion of treasury and agency securities to their portfolio. Many would assume that such stimulus would be associated with a booming economic environment, not a slowing one.
Readers of our letters are familiar with our long-standing assessment that the cause of slower growth is the overly indebted economy with too much non productive debt. Rather than repairing its balance sheet by reducing debt, the U.S. economy is starting to increase its leverage. Total debt rose to 349.3% of GDP in the first quarter, up from 343.7% in the third quarter of 2013.
It is possible to cast an increase in debt in positive terms since it suggests that banks and other financial intermediaries are now confident and are lowering credit standards for automobiles, home equity, credit cards and other types of loans. Indeed, the economy gets a temporary boost when participants become more indebted. This conclusion was the essence of the pioneering work by Eugen von Böhm-Bawerk (1851-1914) and Irving Fisher which stated that debt is an increase in current spending (economic expansion) followed by a decline in future spending (economic contraction).
In concert with this view, but pinpointing the negative aspect of debt, contemporary economic research has corroborated the views of Hyman Minsky (1919-1996) and Charles Kindleberger (1910-2003) that debt slows economic growth at higher levels when it is skewed toward the type of borrowing that will not create an income stream sufficient to repay principal and interest.
Scholarly studies using very sophisticated analytical procedures conducted in the U.S. and abroad document the deleterious effects of high debt ratios. However, the use of a balance sheet measure can be criticized in two ways. First, income plays a secondary role, and second, debt ratios are not an integral part of Keynesian economic theory.
We address these two objections by connecting the personal saving rate (PSR) which is at the core of Keynesian economic analysis, and the private debt to GDP ratio that emerges from non-Keynesian approaches. Our research indicates that both the “Non Keynesian” private debt to GDP ratios, as well as the “Keynesian” PSR, yield equivalent analytical conclusions.
The Personal Saving Rate (PSR) and the Private Debt Linkage
The PSR and the private debt to GDP ratio should be negatively correlated over time. When the PSR rises, consumer income exceeds outlays and taxes. This means that the consumer has the funds to either acquire assets or pay down debt, thus closely linking the balance sheet and income statement. When the PSR (income statement measure) rises, savings (balance sheet measure) increases unless debt (also a balance sheet measure) declines, thus the gap between the Keynesian income statement focus and the non-Keynesian debt ratio focus is bridged.
The PSR and private debt to GDP ratio are, indeed, negatively correlated (Chart 2). The correlation should not, however, be perfect since the corporate sector is included in the private debt to GDP ratio while the PSR measures just the household sector. We used the total private sector debt ratio because the household data was not available in the years leading up to the Great Depression.
The most important conceptual point concerning the divergence of these two series relates to the matter of the forgiveness of debt by the financial sector, which will lower the private debt to GDP ratio but will not raise the PSR. The private debt to GDP ratio fell sharply from the end of the recession in mid-2009 until the fourth quarter of 2013, temporarily converging with a decline in the saving rate. As such, much of the perceived improvement in the consumer sector’s financial condition occurred from the efforts of others. The private debt to GDP ratio in the first quarter of 2014 stood at 275.4%, a drop of 52.5 percentage points below the peak during the recession. The PSR in the latest month was only 1.7 percentage points higher than in the worst month of the recession. Importantly, both measures now point in the direction of higher leverage, with the PSR showing a more significant deterioration. From the recession high of 8.1%, the PSR dropped to 4.8% in April 2014.
Historical Record
The most recently available PSR is at low levels relative to the past 114 years and well below the long-term historical average of 8.5% (Chart 3). The PSR averaged 9.4% during the first year of all 22 recessions from 1900 to the present. However this latest reading of 4.8% is about the same as in the first year of the Great Depression and slightly below the 5% reading in the first year of the Great Recession.
In Dr. Martha Olney’s (University of California, Berkeley and author of Buy Now, Pay Later) terminology, when the PSR falls households are buying now but will need to pay later. Contrarily, if the PSR rises households are improving their future purchasing power. A review of the historical record leads to two additional empirical conclusions. First, the trend in the PSR matters. A decline in the PSR when it has been falling for a prolonged period of time is more significant than a decline after it has risen. Second, the significance of any quarterly or annual PSR should be judged in terms of its long term average.
For example, multi-year declines occurred as the economy approached both the Great Recession of 2008 and the Great Depression of 1929. In 1925 the PSR was 9.2%, but by 1929 it had declined by almost half to 4.7%. The PSR offered an equal, and possibly even better, signal as to the excesses of the 1920s than did the private debt to GDP ratio. Both the level of PSR and the trend of its direction are significant meaningful inputs.
John Maynard Keynes (1883-1946) correctly argued that the severity of the Great Depression was due to under-consumption or over saving. What Keynes failed to note was that the under consumption of the 1930s was due to over spending in the second half of the 1920s. In other words, once circumstances have allowed the under saving event to occur, the net result will be a long period of economic under performance.
Keynes, along with his most famous American supporter, Alvin Hansen (1887-1975), argued that the U.S. economy would face something he termed “an under-employment equilibrium.” They believed the U.S. economy would return to the Great Depression after World War II ended unless the federal government ran large budget deficits to offset weakness in consumer spending. The PSR averaged 23% from 1942 through 1946, and the excessive indebtedness of the 1920s was reversed. Consumers had accumulated savings and were in a position to fuel the post WWII boom. The economy enjoyed great prosperity even though the budget deficit was virtually eliminated. The concerns about the under employment equilibrium were entirely wrong. In Keynes’ defense, the PSR statistics cited above were not known at the time but have been painstakingly created by archival scholars since then.
Implications for 2014-2015
In previous letters we have shown that the largest economies in the world have a higher total debt to GDP today than at the time of the Great Recession in 2008. PSRs also indicate that foreign households are living further above their means than six years ago. According to the OECD, Japan’s PSR for 2014 will be 0.6%, virtually unchanged from 2008. The OECD figure is likely to turn out to be very optimistic as the full effects of the April 2014 VAT increase takes effect, and a negative PSR for the year should not be ruled out. In addition, Japan’s PSR is considerably below that of the U.S. The Eurozone PSR as a whole is estimated at 7.9%, down 1.5 percentage points from 2008. Thus, in aggregate, the U.S., Japan and Europe are all trying to solve an under-saving problem by creating more under-saving. History indicates this is not a viable path to recovery. [reference: Atif Mian and Amir Sufi,. House of Debt, University of Chicago Press 2014]
Japan confirms the experience in the United States because their PSR has declined from over 20% in the financial meltdown year of 1989 to today’s near zero level. Japan, unlike the U.S. in the 1940s, has moved further away from financial stability. Despite numerous monetary and fiscal policy maneuvers that were described as extremely powerful, the end result was that they have not been successful.
U.S. Yields Versus Global Bond Yields
Table one compares ten-year and thirty year government bond yields in the U.S. and ten major foreign economies. Higher U.S. government bond yields reflect that domestic economic growth has been considerably better than in Europe and Japan, which in turn, mirrors that the U.S. is less indebted. However, the U.S. is now taking on more leverage, indicating that our growth prospects are likely to follow the path of Europe and Japan.
With U.S. rates higher than those of major foreign markets, investors are provided with an additional reason to look favorably on increased investments in the long end of the U.S. treasury market. Additionally, with nominal growth slowing in response to low saving and higher debt we expect that over the next several years U.S. thirty year bond yields could decline into the range of 1.7% to 2.3%, which is where the thirty year yields in the Japanese and German economies, respectively, currently stand.
Van R. Hoisington
Lacy H. Hunt, Ph.D.
Like Outside the Box?
Sign up today and get each new issue delivered free to your inbox.
It's your opportunity to get the news John Mauldin thinks matters most to your finances.
Important Disclosures
The article Outside the Box: Hoisington Investment Management: Quarterly Review and Outlook, Second Quarter 2014 was originally published at Mauldin Economics
Great new video, #3 of Bill Poulos's "Portfolio Prophet" trading lab series is now ONLINE!
-->
Subscribe to:
Posts (Atom)
