Our trading partner Chris Vermeulen, who are readers have followed for a while now, is loving what is happening in the markets for the last three weeks. He wants a big bounce here because it is going to set us up with a huge long-term investment position once price confirms this next entry signal.
Last week Chris issued a trade alert to members of his long-term investing newsletter. This allows you to protect your wealth and assets while continuing to take advantage of opportunities generated by the U.S and global markets over the next several months and possibly into next year. This is the first trade alert issued in 2020 of this kind, and he may have another very soon, but it's not too late to take advantage of the first signal.
If you are a trader or investor, with a retirement account of any type, or have assets in the stock market, then you need to take action and sign up to get these important investment trade signals.
We all have trading accounts, and while our trading accounts are important, what is even more important are our long-term investment and retirement accounts. Why? Because they are, in most cases, our largest store of wealth other than our homes.
If they are not protected during a time like this, you could lose another 25-50% or more of your entire net worth. The good news is we can preserve and even grow out long term capital when things get ugly like they are now and Chris shows us how.
Check It Out Here
Sincerely,
Chris Vermeulen
Founder of The Technical Traders
Trade ideas, analysis and low risk set ups for commodities, Bitcoin, gold, silver, coffee, the indexes, options and your retirement. We'll help you keep your emotions out of your trading.
Showing posts with label investment. Show all posts
Sunday, April 12, 2020
We Adjusted Our Retirement Account Positions with This Major Signal Issued - Did You Get The Signal?
Labels:
Chris Vermeulen,
Crude Oil,
gold,
investment,
investor,
newsletter,
Silver,
The Technical Traders,
wealth
Sunday, January 26, 2020
The Black Swan Event Begins
As the Asian markets opened on late Sunday, traders expected a reactionary price move related to the threat of the Wuhan virus and the continued news of its spread. The U.S. Dow Jones futures markets opened close to -225 points lower on Sunday afternoon and were nearly -300 points lower within the first 25 minutes of trading. Gold opened $10 higher and continued to rally to a level above $15 higher.
If this is early price activity, or a reactionary price move, related to fear of what may come, then the warnings signs are very clear that global traders and investors believe this virus outbreak may very well turn into a major Black Swan event.
Our research team believes a 5% to 8% rotation should be considered a normal reversion range where price may find immediate support and attempt to rally from these support levels. Anything beyond 10% may set up a much bigger price reversion event, something akin to a Black Swan event. Therefore, we are advising our friends and followers to take the necessary steps to protect your wealth and assets as this move continued to extend.
This 30 minute YM futures chart highlights the reactionary downside price move (GAP) taking place on the open of the Asian markets. This GAP lower may be just the beginning of a much broader downside price move. We are going to have to wait and see what happens related to the Wuhan virus over the next 14+ days.
Gold shot up nearly 1% in early trading on Sunday. Fear is driving investors to pile into the precious metals markets. As news of this virus continues to hit the news cycle, we expect metals will continue to push higher and higher – likely targeting the $1750 level in Gold.
If you want to see what the big money players own check out these gold charts and a very different interpretation of the gold COT Data here.
If you have not been following our research and if you have not already positioned your portfolio for this potential reversion event, then now would be a good time to start taking action. Do some research on the 1855 Third Plague Event in China where more than 15 million people died (nearly 1.25% of the total global population at the time). If those levels hold for this event, then possibly 60 to 80 million people may die over related to this event.
Crude oil is collapsing again and just his out downside target of $53. Our energy sector trade idea is up over 15% already.
Remember, all of this is speculation at this point. Yet we urge traders to act now to take action to prevent further erosion of their wealth and retirement accounts. Visit the Technical Traders website to learn how we can help you plan for these events, protect your wealth, and find great trades.
As a technical analysis and trader since 1997 I have been through a few bull/bear market cycles, I have a good pulse on the market and timing key turning points for both short term swing trading and long-term investment capital. The opportunities are massive/life changing if handled properly.
Join my Wealth Building Newsletter if you like what you read here and ride my coattails as I navigate these financial markets and build wealth while others lose nearly everything they own.
Chris Vermeulen
The Technical Traders
If this is early price activity, or a reactionary price move, related to fear of what may come, then the warnings signs are very clear that global traders and investors believe this virus outbreak may very well turn into a major Black Swan event.
Our research team believes a 5% to 8% rotation should be considered a normal reversion range where price may find immediate support and attempt to rally from these support levels. Anything beyond 10% may set up a much bigger price reversion event, something akin to a Black Swan event. Therefore, we are advising our friends and followers to take the necessary steps to protect your wealth and assets as this move continued to extend.
30 Minute YM Futures Chart
This 30 minute YM futures chart highlights the reactionary downside price move (GAP) taking place on the open of the Asian markets. This GAP lower may be just the beginning of a much broader downside price move. We are going to have to wait and see what happens related to the Wuhan virus over the next 14+ days.
30 Minute Gold Futures Chart
Gold shot up nearly 1% in early trading on Sunday. Fear is driving investors to pile into the precious metals markets. As news of this virus continues to hit the news cycle, we expect metals will continue to push higher and higher – likely targeting the $1750 level in Gold.
If you want to see what the big money players own check out these gold charts and a very different interpretation of the gold COT Data here.
If you have not been following our research and if you have not already positioned your portfolio for this potential reversion event, then now would be a good time to start taking action. Do some research on the 1855 Third Plague Event in China where more than 15 million people died (nearly 1.25% of the total global population at the time). If those levels hold for this event, then possibly 60 to 80 million people may die over related to this event.
Crude oil is collapsing again and just his out downside target of $53. Our energy sector trade idea is up over 15% already.
Remember, all of this is speculation at this point. Yet we urge traders to act now to take action to prevent further erosion of their wealth and retirement accounts. Visit the Technical Traders website to learn how we can help you plan for these events, protect your wealth, and find great trades.
As a technical analysis and trader since 1997 I have been through a few bull/bear market cycles, I have a good pulse on the market and timing key turning points for both short term swing trading and long-term investment capital. The opportunities are massive/life changing if handled properly.
Join my Wealth Building Newsletter if you like what you read here and ride my coattails as I navigate these financial markets and build wealth while others lose nearly everything they own.
Chris Vermeulen
The Technical Traders
Labels:
analysis,
bear,
black swan,
Bull,
capital,
China,
Chris Vermeulen,
investment,
The Technical Traders,
traders,
wealth
Tuesday, August 7, 2018
Technical Analysis and Rates Unchanged – Here We Go
The U.S. Federal Reserve is one of the only central banks to attempt to raise rates consistently over the past few years, has possibly learned a very valuable lesson – no good comes from raising rates to the point of causing another market collapse. The news that the US Fed will leave interest rates where they are, temporarily, is good news for a number of reasons.
First, this allows the markets to shake out weaker players and weaker components of the corporate world. Where corporate debt levels are concerned, interest rates are tied to debt repayment liabilities and refinancing costs. Firms that are unable to manage at current interest rates certainly would not be happy about rising rates. This allows these corporations to either struggle to resolve their debt issues or collapse under the weight of their own debt. This will also play out in the foreign markets as well.
Second, it allows the housing market and private debt markets to shake out some of the “at risk” consumers. We authored an article a few months ago about how foreclosures and pre-foreclosures were starting to increase in nearly all markets. At the time, many people in the real estate field shrugged off these increases as par for the course. With the decreasing foreign investment in real estate and the increasing pressures on the local consumer markets, we saw a dramatic slowdown in housing starts and sales activities recently. This is because the demand side of the market is falling much faster than the supply capacity.
The uncertainty in the foreign markets, global central banks, and foreign investments have prompted many people to pull out of the local markets – even the hot markets. The at-risk consumers that were trying to sell near this top suddenly found the buyers were just not there or ready to make the commitment. This put the at-risk consumers in a difficult position as they could not flip their houses as easily as they could 6 months ago.
Yet, in the global equity markets, investors can sell or buy with much faster transaction times – at the click of a mouse button in most cases. This allows equity investors to pull capital away from risky investments and migrate that capital into more secure investments in a matter of minutes or hours – not weeks or months. And that is exactly what has been happening over the past 30+ days in the global markets.
Capital is repositioning for the next phase of this market; where the US economy is strong, housing continues to weaken and at-risk consumers continue to feel the pressures of the US Fed interest rate policies. Where foreign consumers attempt to deal with their own version of “central bank hell” and asset devaluations in an attempt to find more secure investment vehicles for their capital. Money market funds, investment funds and, of course, the US value/blue-chip equities are looking very promising right about now.
This Daily SPY chart shows our recent ADLC indicator (price cycle turning points) and our oversold extreme price levels shaded with lime green. When these two things align the market tends to rally for 1-3 days with strong momentum. During pre-market last week, we told our followers that the big gap lower in price was going to be bought and price should rally for 2-3 days, which is exactly what has unfolded thus far.
Global capital will continue to rush into the US markets as long as the US Fed does not do anything to derail things. Our research team believes the US Fed may even decrease the interest rates by 0.25% before the end of the year depending on how much pressure is placed on the economy by these “at risk” participants.
We will continue to keep you updated as to our findings and we want to urge you to visit The Technical Traders Free Market Research to read all of our most recent research posts. You really owe it to yourself to understand what is happening in the global markets right now and how we have continued to stay 30-60 days ahead of these moves for our valued members. There are so many opportunities setting up in the markets for traders it is almost hard to understand the dynamics at play right now. If you want a dedicated team of researchers and traders to help you navigate these markets, then visit The Technical Traders to learn how we can provide you with even more detailed daily research and support.
Chris Vermeulen
Labels:
Chris Vermeulen,
currency,
Dollar,
ETF's,
Federal Reserve,
GDP,
housing,
investment,
stocks
Thursday, November 30, 2017
Capital Repositioning Driving Volatility Higher
Recent moves in the FANG stocks shows that capital is starting to reposition within the global market. As the end of the year approaches, expect more of this type of capital control to drive greater volatility within the markets. At this time of year, especially after such a fantastic bullish run, it is not uncommon to see capital move out of high flying equities and into cash or other investments.
The recent move lower in the NQ has taken many by surprise, but the bullish run in the FANG stocks has been tremendous. Facebook was higher +59% for 2017 (600% 2016 levels). Amazon was up +61% for 2017 (550% 2016 levels). Netflix was up +64.75% for 2017 (600% 2016 levels) and Google was higher by +37% for 2017 (1000% 2016 levels). These are huge increases in capital valuation.
In early 2017, we authored an article about how capital works and always seeks out the best returns in any environment. It was obvious from the moves this year that capital rushed into the US markets with the President Trump’s win and is now concerned that the end of the year may be cause to pull away from the current environment.
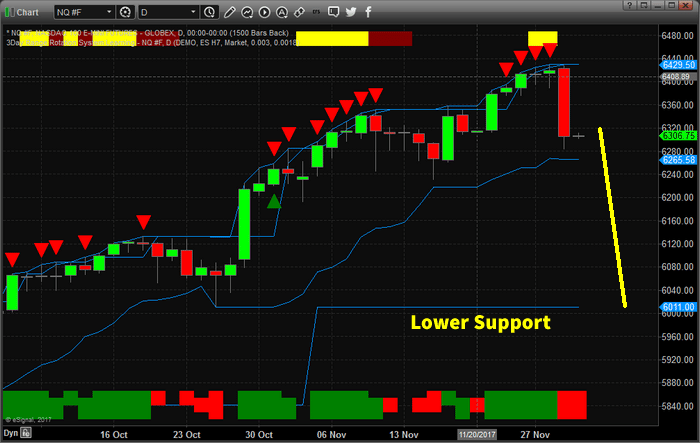
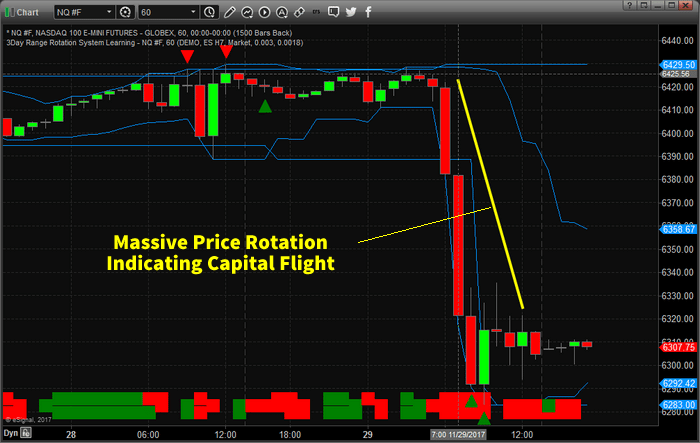
The current decline in the NQ, -2.25% so far, is not a huge decline in price yet. Lower price support is found near the $6000 level. Should this “Price Flight” continue in the NASDAQ, we could be looking at a 6~8% decline, or greater, going into the end of this year.
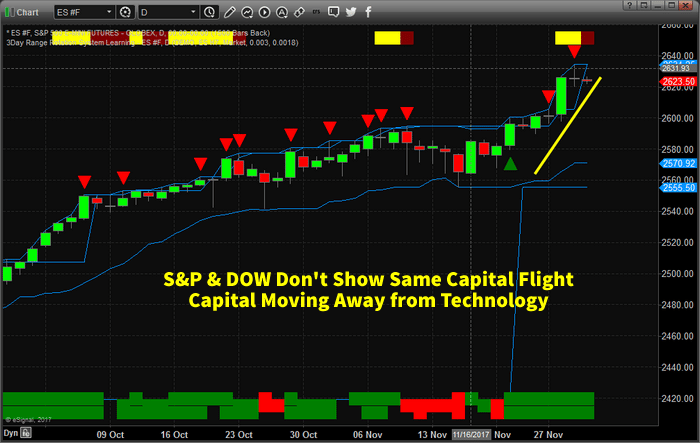
The price swing, this week, was very fast and aggressive. In terms of capital, this was a massive price rotation away from Technology. While the S&P and DOW Industrials continue higher, this presents a cause for concern with regards to the end of year expectations.
Will capital continue to rush into the US markets and specifically Technology stocks? Or will capital rush out of these equities and into other sources of “safety” as technology melts down into the end of 2017? Has the 40~60%+ price rally of 2017 been enough for investors to take their profits and run?
It is quite possible that capital will move to the sidelines through the end of this year and reenter the markets early next year as investors find a better footing for the markets. The facts are, currently, that financials and transportation seem to be doing much better than the FANG stocks. If this continues, we could be looking at a broader shift in the global markets – almost like a second technology bubble burst.
If you want to learn more about how we can assist you with your investment needs, visit The Technical Traders Here to learn more. Our researchers are dedicated to assisting you and in helping you learn to profit from these moves. 2018 is certain to be a dynamic trading year – so don’t miss out.
Labels:
Amazon,
bullish,
capital,
equities,
Gas,
investment,
NASDAQ,
Oil,
President Trump,
profit,
Technology,
trading
Monday, November 20, 2017
Could a Bitcoin Blowout coincide with a Major Market Blowout?
Our team of researchers continues to attempt to identify market strengths and weakness in the US major markets by identifying key, underlying factors of the markets and how they relate to one another.
Recently, we’ve been warning of a potentially explosive bullish move in Metals and our last article highlighted the weakness in the Transportation Index as it relates to the US major markets.
On November 2, 2017, we warned that the NQ volatility would be excessive and that any move near or below 6200 would likely prompt support to drive prices higher as our Adaptive Dynamic Learning model was showing wide volatility and the potential for rotation moves.
This week, we are attempting to highlight a potential move in Bitcoin that could disrupt the global economy and more traditional investment vehicles. For the past few years, Bitcoin has been on a terror to the upside. Recently, a 30% downside price rotation caused a bit of panic in the Crypto world. This -30% decline was fast and left some people wondering what could happen if something deeper were to happen – where would Crypto’s find a bottom. From that -30% low, Bitcoin has recovered to previous highs (near $8000) and have stalled – interesting.
While discussing Bitcoin with some associates a while back, I heard rumor that a move to Bitcoin CASH was underway and that Bitcoin would collapse as some point in the near future. The people I was meeting with were very well connected in this field and were warning me to alert me in case I had any Bitcoin holdings (which I do). I found it interesting that these people were moving into the Bitcoin CASH market as fast as they could. What did they know that I didn’t know and how could any potential Bitcoin blowout drive the global markets?
Panic breeds fear and fear drives the markets (fear or greed). If Bitcoin were to increase volatility beyond the most recent move (-30% in 4 days) – what could happen to the Crypto markets if a bubble collapse or fundamental collapse happened?
How would the major markets react to a Crypto market collapse that destroyed billions in capital? For this, we try to rely on our modeling systems and our understanding of the major markets. Let’s get started by looking at the NASDAQ with two modeling systems (the Fibonacci Price Modeling System and the Adaptive Dynamic Learning system).
This first chart is a Daily Adaptive Dynamic Learning (ADL) model representation of what this modeling system believes will be the highest probability outcome of price going forward 20 days. Notice that we are asking it to show use what it believes will happen from last week’s trading activity (ignoring anything prior). This provides us the most recent and relevant data to review.
We can see from the “range lines” (the red and green price range levels shown on the chart), that upside price range is rather limited to recent highs whereas downside prices swing lower (to near 6200 and below) rather quickly. Additionally, the highest probability price moves indicate that we could see some downside price rotation over the Thanksgiving week followed by a retest of recent high price levels throughout the end of November.
This NQ Weekly chart, below, is showing our Fibonacci price modeling system and the fact that we are currently in an extended bullish run that, so far, shows no signs of stalling. The Fibonacci Price Breach Level (the red line near the right side of the chart) is showing us that we should be paying attention to the 6075 level for any confirmation of a bearish trend reversal. Notice how that aligns with the blue projected downside support level (projected into future price levels). Overall, for the NQ or the US majors to show any signs of major weakness, these Fibonacci levels would have to be tested and breached. Until that happens, expect continued overall moderate bullish price activity. When it happens, look out below.
The next charts we are going to review are the Metals markets (Gold and Silver). Currently, an interesting setup is happening with Silver. It appears to show that volatility in the Silver market will be potentially much greater than the volatility in the Gold market. This would indicate that Silver would be the metal to watch going into and through the end of this year. This first chart is showing the ADL modeling system and highlighting the volatility and price predictions that are present in the Silver market. Pay attention to the facts that ranges and price projections are rather stable till about 15 days out – that’s when we are seeing a massive upside potential in Silver.
This next chart is the Fibonacci Price Modeling system on a Weekly Silver chart. What is important here is the recent price rotation that has setup the Fibonacci Price Breach trigger to the upside (currently). This move is telling us that as long as price stays above $16.89 on a Weekly closing price basis, then Silver should attempt to push higher and higher over time. The projected target levels are $19.50, $20.25 and $21.45. Notice any similarity in price levels between the Fibonacci analysis and the ADL analysis? Yes, that $16.89 level is clearly identified as price range support by the ADL modeling system (the red price range expectation lines).
How will this playout in our opinion with Bitcoin potentially rotating lower off this double top while the metals appear to be basing and potentially reacting to fear in the market? Allow us to explain what we believe will be the most likely pathway forward…
At first, this holiday week in the US, the markets will be quiet and not show many signs of anything. Just another holiday week in the US with the markets mostly moderately bullish – almost on auto-pilot for the holidays. Then closing in on the end of November, we could start to see some increased volatility and price rotation in the metals and the US majors. If Bitcoin has moved by this time, we would expect that it would be setting up a rotational low above the -30% lows recently set. In other words, Bitcoin would likely fall 8~15% on rotation, then stall before attempting any further downside moves.
By the end of November, we expect the US markets to have begun a price pattern formation that indicates sideways/stalling price activity moving into the end of this year. This ADL Daily ES Chart clearly shows what is predicted going forward 20 days with price rotating near current highs for a few days before settling lower (near 2540~2550 through early Christmas 2017). The ADL projected highs are not much higher than recent high price levels, therefore we do not expect the ES to attempt to push much higher than 2595 in the immediate future. It might try to test this level or rotate a bit higher as a washout high, but our analysis shows that prices should be settling into complacency for the next week or two while settling near the lower range of recent price activity.
What you should take away from this analysis is the following : don’t expect any massive upside moves between now and the end of the year that last longer than a few days. Don’t expect the markets to rocket higher unless there is some unexpected positive news from somewhere that changes the current expectations. Expect Silver to begin to move higher in early December as well as expect Gold to follow Silver. We believe Silver is the metal to watch as it will likely be the most volatile and drive the metals move. Expect the major markets to be quiet through the Thanksgiving week with a potential for moderate bullish price activity before settling into a complacent retracement mode through the end of November and early December.
If Bitcoin does what we expect by creating a rotational lower price breakout setup from recent highs, we’ll know within a week or two. If this $8000 level holds as resistance, then we will clearly see Bitcoin rotate into a defensive market pattern (a flag formation or some other harmonic pattern above support). The US majors will likely follow this move as a broader fear could begin gripping the markets.
Lastly, as we mentioned last week, pay very close attention to the Transportation Index and it’s ability to find/hold support. Unless the Transportation index finds some level of support and begins a new bullish trend, we could be in for a more dramatic move early next year. Our last article clearly laid out our concerns regarding the Transportation Index and the broader market cycles. All of our analysis should be taken as segments of a much larger market picture. We are setting up for an interesting holiday season where the market could turn in an instant on fear or news of some global event (like a Bitcoin collapse). The volatility we are seeing our modeling systems predict is increasing (especially in the Silver market over the next few weeks). We could be headed for a bumpy ride with a classic top formation setting up.
Overall, protect your investments and your long positions. Many people will be away from their PCs and away from the markets over the holidays. It is important that you understand the risks that continue to play out in the markets. Pay attention to market sectors that are at risk of showing us greater fear or weakness in the major markets. Pay attention to these increases in volatility and price rotation. Most of all, pay attention to the market’s failure to move higher over this holiday season because we should be traditionally expecting the Christmas Rally to push equities moderately higher at this time.
Should we see any more clear signs of weakness or market rotation, you will know about it with our regular updates to the public. If you want to know how Acitve Trading Partners can assist you in staying up to day with the market cycles and analysis, then visit the Active Trading Partners and learn how we can assist you with detailed market research, daily updates, trading signals and more.
We are dedicated to helping you achieve success in the markets and do our best to make sure you are prepared for any future market moves. See how we can assist you now and in 2018 to achieve greater success.
Labels:
Bitcoin,
Bitcoin Cash,
cash,
Chris Vermeulen,
cryptos,
Drilling,
Gas,
gld,
global,
investment,
markets,
money,
Oil,
Silver,
slv
Thursday, June 22, 2017
How Gold Stocks Could Deliver Historic Gains in the Years Ahead
My regular readers know why I believe the gold price is poised to move from its current level of around $1,250 per ounce to $1,500… $2,000… and eventually past $3,000. Right now, we are exiting the eye of the giant financial hurricane that we entered in 2007, and we’re going into its trailing edge. It’s going to be much more severe, different, and longer lasting than what we saw in 2008 and 2009.
In a desperate attempt to stave off a day of financial reckoning during the 2008 financial crisis, global central banks began printing trillions of new currency units. The printing continues to this day. And it’s not just the Federal Reserve that’s doing it: it’s just the leader of the pack. The U.S., Japan, Europe, China… all major central banks are participating in the biggest increase in global monetary units in history.
These reckless policies have produced not just billions, but trillions in malinvestment that will inevitably be liquidated. This will lead us to an economic disaster that will in many ways dwarf the Great Depression of 1929–1946. Paper currencies will fall apart, as they have many times throughout history. This isn’t some vague prediction about the future. It’s happening right now. The Canadian dollar has lost 33% of its value since 2013. The Australian dollar has lost 27% of its value during the same time. The Japanese yen and the euro have crashed in value. And the U.S. dollar is currently just the healthiest horse on its way to the glue factory.
These moves show that we’re in the early stages of a currency crisis. But if you make the right moves, you could actually make windfall gains instead of suffering losses. Here’s how to do it. The huge winner during this crisis will be the only currency that has real value: gold.
Gold has been used as money for thousands of years because it has a unique combination of qualities. Very briefly, it’s durable, easily divisible, convenient to carry, consistent around the world, and has value in and of itself. Just as important, governments can’t create gold out of thin air. It’s the only financial asset that’s not simultaneously someone else’s liability.
When people wake up and realize that most banks and governments are bankrupt, they’ll flock to gold… just as they’ve done for centuries. Gold will rise multiples of its current value. I expect a 200% rise from current levels, at the minimum. There are many reasons, which we don’t have room to cover here, why gold could see a 400% or 500% gain.
This should produce a corresponding bull market in gold stocks… perhaps of a magnitude we’ve never seen. A true mania for gold stocks could develop over the coming years. This could make anyone who buys gold stocks at their current depressed levels very rich.
What History Teaches Us About Great Speculations
Many of the best speculations have a political element to them. Governments are constantly creating distortions in the market, causing misallocations of capital. Whenever possible, the speculator tries to find out what these distortions are, because their consequences are predictable.
They result in trends you can bet on. Because you can almost always count on the government to do the wrong thing, you can almost always safely bet against them. It’s as if the government were guaranteeing your success. The classic example, not just coincidentally, concerns gold.
The U.S. government suppressed its price for decades while creating huge numbers of dollars before it exploded upward in 1971. Speculators who understood some basic economics positioned themselves accordingly. Over the next nine years, gold climbed more than 2,000% and many gold stocks climbed by more than 5,000%.
Governments are constantly manipulating and distorting the monetary situation. Gold in particular, as the market’s alternative to government money, is always affected by that. So gold stocks are really a way to short government — or go long on government stupidity, as it were.
The bad news is that governments act chaotically, spastically.
The beast jerks to the tugs on its strings held by various puppeteers. But while it’s often hard to predict price movements in the short term, the long term is a near certainty. You can bet confidently on the end results of chronic government monetary stupidity. Mining stocks are extremely volatile for that very same reason. That’s good news, however, because volatility makes it possible, from time to time, to get not just doubles or triples but 10 baggers, 20 baggers, and even 100 to 1 shots.
When gold starts moving higher, it’s going to direct a lot of attention towards gold stocks. When people get gold fever, they are not just driven by greed, they’re usually driven by fear as well, so you get both of the most powerful market motivators working for you at once. It’s a rare class of securities that can benefit from fear and greed at once. Remember that the Fed‘s pumping-up of the money supply ignited a huge bubble in tech stocks in the late ‘90s, and then an even more massive global bubble in real estate that burst in 2008. But they’re still creating tons of dollars.
This will inevitably ignite other asset bubbles. Where? I can’t say for certain, but I say the odds are extremely high that as gold goes up, a lot of this funny money is going to pour into these gold stocks, which are not just a microcap area of the market but a nanocap area of the market. The combined market capitalization of the 10 biggest U.S. listed gold stocks is less than 6% of the size of Facebook. I’ve said it before, and I’ll say it again: When the public gets the bit in its teeth and wants to buy gold stocks, it’s going to be like trying to siphon the contents of the Hoover Dam through a garden hose.
Gold stocks, as a class, are going to be explosive. Now, you’ve got to remember that most of them are junk. Most will never, ever find an economical deposit. But it’s hopes and dreams that drive them, not reality, and even those without merit can still go up 10, 20, or 30 times your entry price. And companies that actually have the goods can go much higher than that.
You buy gold, the metal, because you’re prudent. It’s for safety, liquidity, insurance. The gold stocks, even though they explore for or mine gold, are at the polar opposite of the investment spectrum; you buy them for their extreme volatility, and the chance they offer for spectacular gains. It’s rather paradoxical, actually.
Why Gold Stocks Are an Ideal “Asymmetric Bet”
Symmetry is attractive in some forms. The more symmetrical someone’s face is, the more physically attractive they are considered to be. Symmetry is often attractive in architecture. But when it comes to investing and speculating in the financial markets, the expert financial operator eschews symmetry. Symmetry is for suckers.
The expert financial operator hunts for extreme asymmetry.
An asymmetric bet is one where the potential upside of a position greatly exceeds its potential downside. If you risk $1 for the chance of making $20, you’re making an asymmetric bet. Amateur investors too often risk 100% of their money in the pursuit of a 10% return. These are horrible odds. But the financially and statistically illiterate take them. You might do better in a casino or most sports betting. It’s one of the key reasons most people struggle in the market.
I’ve always been more attracted to asymmetric bets… where I stand a good chance of making 10, 50, even 100 times the amount I’m risking. I’m not interested in even bets. I’m only taking the field if my potential upside is much, much greater than my potential downside. Because of the extreme asymmetry gold stocks offer—because of their extreme upside potential when they’re cheap—you don’t have to take a big position in them to make a huge impact on your net worth. A modest investment of $25,000 right now could turn into $500,000 in five years. It has happened before and it will happen again.
Right now gold stocks are near a historic low. I’m buying them aggressively. At this point, it’s possible that the shares of a quality exploration company or a quality development company (i.e., one that has found a deposit and is advancing it toward production) could still go down 10, 20, 30, or even 50 percent. But there’s an excellent chance that the same stock will go up by 10, 50, or even 100 times. I hate to use such hard to believe numbers, but that is the way this market works. When the coming resource bubble is ignited, the odds are excellent we’ll be laughing all the way to the bank in a few years.
No one, including me, knows that the Mania Phase is just around the corner. But I’ve operated in this market for over 40 years. This is a very reasonable time to be buying these stocks. And it’s absolutely a good time to start educating yourself about them. There’s an excellent chance a truly massive bubble is going to be ignited in this area. If so, the returns are going to be historic.
Regards,
Doug Casey
Founder, Casey Research
Note: Casey Research’s resident gold stock specialist, Louis James, has just unveiled a proprietary strategy for selecting small gold stocks. Over a 30 year historical backtest, the strategy had a 95% success rate. Remarkably, the strategy even produced winning plays during gold’s $700 drop from 2011 to 2015.
So, if the Mania Phase Doug predicts takes off, the asymmetrical gains you’ll see from these small gold stocks could hand you 10, 50, or even 100 times your money. Here, I explain the full story on Louis’ strategy so you can review it for yourself
Labels:
capital,
crisis,
Dollar,
Doug Casey,
Exploration,
gld,
gold,
investment,
stocks,
strategy
Friday, April 7, 2017
Surviving and Thriving During an Economic Collapse
By Nick Giambruno
In just over a century, the international monetary system has collapsed three times: in 1914, in 1939, and in 1971, when Nixon severed the dollar’s last ties to gold. We are due for another major breakdown soon.
This time, the US dollar will lose its status as the world’s premier reserve currency. And the ramifications of that happening are hard to overstate. It will likely be the tipping point at which the US government becomes desperate enough to officially restrict the movement of people and their money… desperate enough to nationalize retirement savings… and desperate enough to make other forms of overt wealth confiscation routine.
For decades, countries around the world have conducted most of their international trade in US dollars. If they want to play in the international sandbox, most have to buy US dollars on the currency market first. This creates a (frequently artificial) demand for dollars, which makes those dollars more valuable.
Imagine the overall boost this arrangement gives to the dollar’s value. It’s enormous.
This system allows the US government and US citizens to live way beyond their means. It also gives the US government immense geopolitical leverage. It can pick and choose which countries can participate in the US-dollar-based financial system—and, by extension, the vast majority of international trade.
All of these unique benefits will disappear when the dollar loses its premier status. No one knows exactly when that will happen, but we’re quickly moving in that direction. Russia, China, Brazil, and India are all making serious moves to dump the dollar and trade in their own currencies. The momentum is quickly gaining critical mass.
I believe it won’t be long before the US government will be desperate enough to enact the restrictive measures we all fear. It’s important to prepare for the economic and financial consequences now. However, you also need to prepare for the sociopolitical consequences of the next economic collapse. It’s probably not going to happen tomorrow, but the direction the bankrupt US government is headed is clear.
Once the dollar loses its status as the world’s premier currency, your options for protecting your savings will have likely narrowed significantly, if not disappeared altogether. It’s important to act before that happens.
P.S. New York Times best-selling author Doug Casey and I think that a crisis for the record books is coming soon. We think your savings are highly vulnerable. There’s a good chance you could be wiped out.
That’s why we released an urgent new video on surviving and thriving during the next financial crisis.
Click here to watch it now.
The article Surviving and Thriving During an Economic Collapse was originally published at caseyresearch.com.
Labels:
China,
currency,
Dollar,
gold,
investment,
Nick Giambruno,
Nixon,
Russia,
stocks,
US
Tuesday, April 4, 2017
Can You Spot the Pattern That Sent Facebook Soaring?
In the final months of 2016 Facebook stock was all over the place. It traded up, down and sideways. Beneath the surface two primal market forces were at work, fighting to control the stock’s direction. On December 30th these forces collided. What happened next was shocking, Facebook popped 8.32% by January 10th.
Facebook call options were up 235.06% in just 11 days. A $1,000 investment would have paid you $2,350 in less than two weeks. And the crazy thing? These events happen all the time, you just need to know where to find them.
Get The Facts Here
Very few traders know about this phenomenon. Even fewer can spot it at work in a stock before an explosive 196%, 228% or 339% move happens. Now you can find out how it works BEFORE the next event strikes.
Watch Right Now
Ray @ the Crude Oil Trader
Labels:
call options,
events,
FB,
investment,
options,
stock's,
traders,
Trading Concepts
Monday, March 6, 2017
The Truth About Your Future: The Money Guide You Need Now, Later, and Much Later
New York Times bestselling author and legendary investment guru Ric Edelman reveals his forward thinking guide on how technology and science will reshape the way we save, invest, and plan for the future. Technology and science are evolving at a blistering, almost incomprehensible pace.
Get your copy of The Truth About Your Future Right Here
The Human Genome Project took eleven years and $2.7 billion dollars to complete. Today, it would take two days to finish, and cost less than getting a pizza delivered. It’s estimated that forty percent of the current Fortune 500 companies will no longer exist by 2025. In 2005, half a billion devices were connected to the Internet. By 2030, that number will reach one trillion.
The traditional paradigms of how we live, learn, and invest are shifting under our feet. Ric Edelman has seen the future, and he explains how smart investors can adapt and thrive in today’s changing marketplace. Using the same prophetic insight that has made him an iconic financial adviser, Edelman offers sound, practical investment advice through the lens of recent scientific and technological advancements.
He illustrates how discoveries in robotics, nanotechnology, 3D printing, solar energy, biotechnology, and medicine will redefine our life expectancies, careers, and retirements. As we live and work longer, Edelman provides clear advice on how to recalibrate the way we save for college, invest during our careers, and plan for retirement.
The Truth About Your Future, featuring Edelman’s proven advice and trademark humor, is a timely, must-have guide for anyone serious about successfully adapting to the ever-evolving financial landscape.
Get your copy of Ric's new book Here > On Amazon.com
Labels:
Fortune 500,
future,
genome,
invest,
investment,
nanotechnology,
pizza,
retirements,
Ric Edelman,
science,
solar energy,
Trends
Monday, January 4, 2016
How Saudi Arabia and OPEC are Manipulating Oil Prices
About eighteen months ago the international price of WTI Crude Oil, at the close of June 2014, was $105.93 per barrel. Flash forward to today; the price of WTI Crude Oil was just holding above $38.00 per barrel, a drastic fall of more than 65% since June 2014. I will point out several reasons behind this sharp, sudden, and what now seems to be prolonged slump.
The Big Push
Despite a combination of factors triggering the fall in prices, the biggest push came from the U.S. Shale producers. From 2010 to 2014, oil production in the U.S. increased from 5,482,000 bpd to 8,663,000 (a 58% increase), making the U.S. the third largest oil-producing country in the world. The next big push came from Iraq whose production increased from 2,358,000 bpd in 2010 to 3,111,000 bpd in 2014 (a 32% increase), mostly resulting from the revival of its post war oil industry.
The country-wide financial crunch, and the need for the government to increasingly export more to pay foreign companies for their production contracts and continue the fight against militants in the country took production levels to the full of its current capacity. In addition; global demand remained flat, growing at just 1.1% and even declining for some regions during 2014. Demand for oil in the U.S. grew just 0.6% against production growth of 16% during 2014.
Europe registered extremely slow growth in demand, and Asia was plagued by a slowdown in China which registered the lowest growth in its demand for oil in the last five years. Consequently, a global surplus was created courtesy of excess supply and lack of demand, with the U.S. and Iraq contributing to it the most.
The Response
In response to the falling prices, OPEC members met in the November of 2014, in Vienna, to discuss the strategy forward. Advocated by Saudi Arabia, the most influential member of the cartel, along with support from other GCC countries in the OPEC, the cartel reluctantly agreed to maintain its current production levels. This sent WTI Crude Oil and Brent Oil prices below $70, much to the annoyance of Russia (non-OPEC), Nigeria and Venezuela, who desperately needed oil close to $90 to meet their then economic goals.
For Saudi Arabia, the strategy was to leverage their low cost of production advantage in the market and send prices falling beyond such levels so that high cost competitors (U.S. Shale producers are the highest cost producers in the market) are driven out and the market defines a higher equilibrium price from the resulting correction. The GCC region, with a combined $2.5 trillion in exchange reserves, braced itself for lower prices, even to the levels of $20per barrel.
The Knockout Punch
By the end of September 2014, according to data from Baker Hughes, U.S. Shale rigs registered their highest number in as many years at 1,931. However, they also registered their very first decline to 1,917 at the end of November 2014, following OPEC’s first meeting after price falls and its decision to maintain production levels. By June 2015, in time for the next OPEC meeting, U.S. Shale rigs had already declined to just 875 by the end of May; a 54% decline.
The Saudi Arabia strategy was spot on; a classic real-life example of predatory price tactics being used by a market leader, showing its dominant power in the form of deep foreign-exchange pockets and the low costs of production. Furthermore, on the week ending on the date of the most recent OPEC meeting held on December 4th, 2015, the U.S. rig count was down even more to only 737; a 62% decline. Despite increased pressure from the likes of Venezuela, the GCC lobby was able to ensure that production levels were maintained for the foreseeable future.
Now What?
Moving forward; the U.S. production will decline by 600,000 bpd, according to a forecast by the International Energy Agency. Furthermore, news from Iraq is that its production will also decline in 2016 as the battle with militants gets more expensive and foreign companies like British Petroleum have already cut operational budgets for next year, hinting production slowdowns. A few companies in the Kurdish region have even shut down all production, owing to outstanding dues on their contracts with the government.
Hence, for the coming year, global oil supply is very much likely to be curtailed. However, Iran’s recent disclosure of ambitions to double its output once sanctions are lifted next year, and call for $30 billion in investment in its oil and gas industry, is very much likely to spoil any case for a significant price rebound.
The same also led Saudi Arabia and its GCC partners to turn down any requests from other less-economically strong members of OPEC to cut production, in their December 2015, meeting. Under the current scenarios members like Venezuela, Algeria and Nigeria, given their dependence on oil revenues to run their economies, cannot afford to cut their own production but, as members of the cartel, can plea to cut its production share to make room for price improvements, which they can benefit from i.e. forego its market share.
It’s Not Over Until I’ve Won
With news coming from Iran, and the successful delivery of a knockout punch to a six-year shale boom in the U.S., Saudi Arabia feared it would lose share to Iran if it cut its own production. Oil prices will be influenced increasingly by the political scuffles between Saudi Arabia and its allies and Iran. The deadlock and increased uncertainty over Saudi Arabia and Iran’s ties have sent prices plunging further. The Global Hedge Fund industry is increasing its short position for the short-term, which stood at 154 million barrels on November 17th, 2015, when prices hit $40 per barrel; all of this indicating a prolonged bear market for oil.
One important factor that needs to be discussed is the $1+ trillions of junk bonds holding up the shale and other marginal producers. As you know, that has been teetering and looked like a crash not long ago. The pressure is still there. As the shale becomes more impaired, the probability of a high yield market crash looks very high. If that market crashes, what happens to oil? Wouldn’t there be feedback effects between the oil and the crashing junk market, with a final sudden shutdown of marginal production? Could this be the catalyst for a quick reversal of oil price?
The strategic interests, primarily of the U.S. and Saudi Arabia; the Saudis have strategically decided to go all in to maintain their market share by maximizing oil production, even though the effect on prices is to drive them down even further. In the near term, they have substantial reserves to cover any budget shortfalls due to low prices. More importantly, in the intermediate term, they want to force marginal producers out of business and damage Iran’s hopes of reaping a windfall due to the lifting of sanctions. This is something they have in common with the strategic interests of the U.S. which also include damaging the capabilities of Russia and ISIS. It’s certainly complicated sorting out the projected knock-on effects, but no doubt they are there and very important.
I’ll Show You How Great I Am
Moreover, despite a more than 50% decline in its oil revenues, the International Monetary Fund has maintained Saudi Arabia’s economy to grow at 3.5% for 2015, buoyed by increasing government spending and oil production. According to data by Deutsche Bank and IMF; in order to balance its fiscal books, Saudi Arabia needs an oil price of$105. But the petroleum sector only accounts for 45% of its GDP, and as of June 2015, according to the Saudi Arabian Monetary Agency, the country had combined foreign reserves of $650 billion. The only challenge for Saudi Arabia is to introduce slight taxes to balance its fiscal books. As for the balance of payments deficit; the country has asserted its will to depend on its reserves for the foreseeable future.
Conclusion
The above are some of the advantages which only Saudi Arabia and a couple of other GCC members in the OPEC enjoy, which will help them sustain their strategy even beyond 2016 if required. But I believe it won’t take that long. International pressure from other OPEC members, and even the global oil corporations’ lobby will push leaders on both sides to negotiate a deal to streamline prices.
With the U.S. players more or less out by the end of 2016, the OPEC will be in more control of price fluctuations and, therefore, in light of any deal between Iran and Saudi Arabia (both OPEC members) and even Russia (non-OPEC), will alter global supply for prices to rebound, thus controlling prices again.
What we see now in oil price manipulation is just the mid-way point. Lots of opportunity in oil and oil related companies will slowly start to present themselves over the next year which I will share my trades and long term investment pays with subscribers of my newsletter at The Gold & Oil Guy.com
Chris Vermeulen
Labels:
Gas,
GCC,
gold and oil guy,
hedge fund,
investment,
ISIS,
Oil,
OPEC,
Petroleum,
production,
Russia,
sanctions,
Saudi Arabia,
shale,
surplus,
WTI,
yield
Subscribe to:
Posts (Atom)