This, the final section of this multi-part research article, will continue our exploration of the consequences that may result from our ADL predictive modeling system’s suggestion that Oil may continue to fall to levels below $40 over the next few months.
In Part I and Part II, we’ve highlighted what we believe to be very compelling evidence that any continue oil price decline from current levels may be setting up the global markets for a massively volatile price reversion – similar to what happened in 1929.
Prior to the stock market collapse in 1929 and the start of the Great Depression, commodity prices collapsed in 1921 and again in 1930. This commodity price collapse was the result of over-supply and a dramatic change in investor mentality. The shift away from tangible items and real successful investing/manufacturing and towards speculation in the housing markets and stock market.
Today, we want to focus on some of the core elements of our current global economic structure to attempt to present any more compelling evidence of a commodity collapse event that may happen after the past 7+ years of a massive credit market expansion event. Allow us to briefly cover the events of the past 20 years.
You can get my daily market analysis articles and trade ideas by opting into my free market trend signals newsletter.
1999: the DOT COM bubble burst after a mild recession in 1993-94 and a stock market rally from 1996 to 1999
September 11, 2001: Terrorist Attack on US soil. Shocked the world and global stock markets. Sent the world’s economy into severe contraction. US Fed lowered interest rates from 6.25% to 1.0% from 2001 to 2003.
2004-06: US Fed begins raising rates from 1.0% and gradually increased rates to 5.25% in August 2006: +525%. Pushing the US credit market, and housing market, over the edge and starting the 2008 Credit Crisis.
2007-2008: US Fed lowered interest rates to near ZERO over a very short 16-month span of time as the US Credit Crisis event unfolded.
2009-15: US Fed continued to keep interest rates near zero throughout this time-frame and continued to pump capital in the global capital markets with multiple QE and debt buying events. Other global central banks followed the US lead providing additional capital throughout the global markets. This massive expansion of credit/debt over a 7+ year span of time allowed foreign nations to “binge” on cheap US and Euro credit/debt while an Emerging Market and Foreign Market recovery were taking place.
2016-2019: US Fed raised interest rates from 0.08% to 2.42% over this span of time. Pushing US Fed rates up by the highest percentage levels EVER: +3025%
This continued global cycle of “boom and bust” has wreaked havoc on global consumers and business enterprises. Over the past 20+ years, various cycles of economic appreciation and depreciation have left some people considerably better suited to deal with these cycles while others have been completely destroyed by these events. Now, it appears we are entering another period of “early warning” as global manufacturing activity, growth and economic output appears to be waning. Are we entering another period like the 1929 to 1940 period of the US where a global economic contraction resulted in a deeper economic recession/depression and took 15+ years to recover from?
The US Fed has recently started acquiring assets again – at a far greater rate than at any time since 2012. It is very likely that the US Fed is “front-running” a crisis event that is already starting to unravel again – possibly aligned with institutional banking entities and global credit/debt risks.
(Source: https://wolfstreet.com)
Chinese factory orders have continued to fall recently and the news is starting to trickle out of China that the US trade tariffs have done far greater damage than currently expected. This suggests that manufacturing, exports, and GDP for China have entered a massive decline. What happens next is that commodity prices collapse because of the lack of demand from manufacturers and consumers. (Source: https://www.yahoo.com/finance/)
Chinese new loan origination rates have fallen to a 22 month “new low” – which suggests corporate and consumer borrowers are simply not willing to take on any new debt/credit at the moment. This happens when a population decides they want to “disconnect” from any economic risks and shift towards a “protectionist” process. (Source: https://finance.yahoo.com)
Recent news suggests that Chinese demand for European consumer and luxury goods has also contracted dramatically. Germany will release GDP estimates on November 14th. It is our opinion that the Chinese have already shifted into a more protectionist consumer stance and that would mean that demand for non-essential items (call them high-risk purchases) are very low at this time. If this is the case, the lack of true demand origination out of China/Asia could push much of Europe into a recession. (Source: https://www.yahoo.com/)
The last thing China would want right now is to blow the potential for any type of US/China trade deal – even if it means giving up more than they may have considered many months ago. More tariffs or any type of tit-for-tat retaliatory trade war would not be in the best interest of either party at this stage of the game. Who flinches first? The US, or China, or the rest of the world?
So, the question, again, becomes...“will a commodity collapse lead the global stock market into a prolonged period of price decline and/or a global recession over the next 10+ years?”
If so, can we expect commodities to collapse as they did after the 1929 stock market peak?
You may remember this chart from the earlier sections of this multi-part article. It highlights what happened leading up to the 1929 stock market crash and how early warning signs of manufacturing and agriculture weakness continued to plague the markets while speculation in housing and the stock market pushed certain asset values much higher near the end of the “Roaring 20s”.
Are we setting up for the same type of event right now where global trade, manufacturing, and agriculture are weakening after the 2008 Credit Crisis and we are meandering towards a repetition of the events that led to the “Great Depression”? Will commodities prices collapse to 2002 or 2003 levels for most items? Will Oil collapse to levels below $30 ppb over the next 6 to 12+ months? And what will happen to Gold and Silver throughout this time?
Can we navigate through these troubling events without risking some type of new collapse event or reversion event? Are the central banks prepared for this? Are traders/investors prepared for this? Just how close are we to the start of this type of event?
The answers lie in what we do now and how the commodities react over the next 12+ months. The one major difference between now and 1929 is that the world is far more inter-connected economically and there are more people throughout the world that have moved into the “economic class”. Thus, it is our opinion that any event that is likely to happen will be followed by a moderately strong recovery event – no matter how severe the outcome. The world is in a different place right now compared to 1929. Overall, only time will tell if our research and ADL predictive modeling system is accurate with respect to future oil prices.
We believe it is critical for all traders to understand what lies ahead and the risks involved in “playing dumb” about the current market environment. We recently authored an article titled “Welcome to the Zombie-land for investors” and highly suggest you read it. Our researchers will share this one component that should help to ease some of the stress you may be feeling right now – the most capable, secure, mature and best funded (reserves) economies on the planet will likely lead any recovery process should an event as this happen. Therefore, look for strengths in the most mature and capable economies on the planet if some new crisis event begins.
Even if a trade deal between the US and China were to happen today and eliminate all trade tariffs, would this change anything or would this simply pour fuel onto the “capital shift” fire that is already taking place with speculation reaching frothy levels?
If you want to earn 34%-50% a year return on your trading account with very few ETF trades then join us at the Wealth Building Newsletter today!
The Technical Traders
Trade ideas, analysis and low risk set ups for commodities, Bitcoin, gold, silver, coffee, the indexes, options and your retirement. We'll help you keep your emotions out of your trading.
Showing posts with label profit. Show all posts
Monday, November 18, 2019
When Crude Oil Collapses Below $40 What Happens - Part III
Labels:
China,
Chris Vermeulen,
Crude Oil,
Gas,
great depression,
investor,
profit,
stocks,
tariffs,
The Technical Traders,
trade deal
Tuesday, June 4, 2019
Fibonacci Support May Signal Bounce in Crude Oil and Equities
We want to take a moment to point out that a Fibonacci 100% price move setup may prompt an upside price swing over the next few days and weeks. Many traders fail to identify this setup and get caught up in the current price trend. This happens because we lose focus on the fact that price always moves in segments or legs – from one peak or trough to another peak or trough. The process of creating these segments or legs is usually structured in these types of Fibonacci price increment, and Fib targets I have personally found to be the most accurate for spotting profit taking and turning points.
We provide two very clear examples of this type of setup and how it has worked in the past. We urge all traders to understand there are many examples of larger Fibonacci price expansion legs throughout history. These examples of the 100% Fibonacci price leg are unique instances of price movement and, after confirmation of a base/reversal, can become very valid trading signals.
This first example is the ES (E-Mini S&P Futures). You can see from this chart the earlier examples of the 100% Fibonacci price legs working in the October 2018 downward price move. The current downward price legs have set up a perfect 100% Fibonacci price expansion leg and we believe support may form near $2732.
We would normally wait for some type of price confirmation that this level is going to act as support – for example, a solid reversal bar or Japanese Candlestick price pattern. After confirmation is achieved, a price rotation equal to 60% to 95% of the last downward price leg can be expected.
This next example shows Crude Oil and the most recent downward two Fibonacci Price Legs. The first resulted in a very quick upside price rotation (highlighted by the green arrow near May 20). The second downside Fibonacci Price Leg just ended near $53.30.
It is our belief that Oil will find support near this $53.30 level and rally back above $56 from these lows. The only thing we are waiting for is some type of technical price confirmation of this bottom setup and we can expect a 4% to 8% upside price swing in Crude Oil.
Over the past 21+ months, we’ve highlighted some of the best tools and techniques we use to find great trading signals. This one technique, the Fibonacci 100% Price Expansion Leg, is just one of the tools we use to find trades and targets for our trade alerts for members.
The more one understands how price works and how the markets operate as a Symphony of price actions, one can find opportunities for great trades almost all the time. Skill and experience make the difference when deciding when to trade and what to trade and that’s what we provide.
We’ve now shown you two different price setups using Fibonacci price theory and the only thing we have to do is wait for a technical price confirmation before finding our entry trade. We’ll see how this plays out over the next few days and weeks. Remember, we are not proposing these as “major price bottoms”. They are “upside pullback trades” (bounces) at this point. A bullish price pullback in a downtrend.
Labels:
bullish,
charts,
Chris Vermeulen,
Crude Oil,
currencies,
ES,
fibonacci,
profit,
stocks,
The Technical Traders,
trades
Thursday, March 14, 2019
Countdown to the Precious Metals Breakout Rally - Here is Our Targeted Entry Levels
If you have been following our research over the past few months, you already know that we’ve called just about every major move in Gold over the past 14+ months. Recently, we called for Gold to rally to $1300 area, establish a minor peak, stall and retrace back to setup a momentum base pattern. We predicted this move to take place back in January 2019 – nearly 30+ days before it happened.
Now, we are publishing this research post to alert you that we are about 15~30 days away from the momentum base setup in Gold which will likely mirror in Silver. Thus, we have about 20+ days to look for and target entry opportunities in both Gold and Silver before this momentum bottom/base sets up.
This Monthly Gold chart, below, shows you the historic peaks that make up a current resistance level near 1370. This level is critical in understanding how the momentum base and following breakout will occur. This resistance level must be broken before the upside rally can continue above $1400, then $1500. Ultimately, the momentum base we are expecting for form before April 21st is the “last base” to setup before a much bigger upside price move takes place. In other words, pay attention over the next 30 days before this move happens.
This next Monthly Silver chart is the real gem of the precious metals world. The upside potential for Silver is actually much bigger than Gold currently. Any breakout move will likely see Silver push well above $30 per ounce and we just need to watch the $18.90 level for signs the breakout is beginning. Silver will follow a similar basing patter as Gold. We expect only about 30 days of buying opportunity left before this basing pattern is completed. Again, watch the April 21st date as the key date for the breakout move to begin.
Palladium has reached our initial Fibonacci upside price targets. We expect price to consolidated and potentially rotate near the $1500 price level. Ideally, price could fall below the $1300 price level and target the $1100 area before finding any real support. As long as industrial demand continues for Palladium, we expect to see continued upside price activity over the long run. Right now, we are expecting a price contraction as global industrial demand may falter a bit.
Please consider the research we are presenting to you today. Our predictive modeling systems have been calling the metals markets quite accurately over the past 14+ months. If our prediction of a momentum base on or near April 21st is correct, then we should begin to see an incredible upside price swing in Gold and Silver shortly after this date. You won’t want to miss this one – trust us. There will be time to catch this move when it starts – it could be an extended upside move.
Pay attention and put April 21st on your calendar now.
If you like our research and our level of insight into the markets, then take a minute to visit our site to learn how we help our clients find and execute for success. We’ve been calling these market moves almost perfectly over the past 18+ months. Learn how our research team can help you stay ahead of these swings in price and find new opportunities for skilled traders. Take a minute to see how we can help you find and execute better trades by visiting The Technical Traders today.
Chris Vermeulen
Technical Traders Ltd.
Now, we are publishing this research post to alert you that we are about 15~30 days away from the momentum base setup in Gold which will likely mirror in Silver. Thus, we have about 20+ days to look for and target entry opportunities in both Gold and Silver before this momentum bottom/base sets up.
This Monthly Gold chart, below, shows you the historic peaks that make up a current resistance level near 1370. This level is critical in understanding how the momentum base and following breakout will occur. This resistance level must be broken before the upside rally can continue above $1400, then $1500. Ultimately, the momentum base we are expecting for form before April 21st is the “last base” to setup before a much bigger upside price move takes place. In other words, pay attention over the next 30 days before this move happens.
This next Monthly Silver chart is the real gem of the precious metals world. The upside potential for Silver is actually much bigger than Gold currently. Any breakout move will likely see Silver push well above $30 per ounce and we just need to watch the $18.90 level for signs the breakout is beginning. Silver will follow a similar basing patter as Gold. We expect only about 30 days of buying opportunity left before this basing pattern is completed. Again, watch the April 21st date as the key date for the breakout move to begin.
Palladium has reached our initial Fibonacci upside price targets. We expect price to consolidated and potentially rotate near the $1500 price level. Ideally, price could fall below the $1300 price level and target the $1100 area before finding any real support. As long as industrial demand continues for Palladium, we expect to see continued upside price activity over the long run. Right now, we are expecting a price contraction as global industrial demand may falter a bit.
Please consider the research we are presenting to you today. Our predictive modeling systems have been calling the metals markets quite accurately over the past 14+ months. If our prediction of a momentum base on or near April 21st is correct, then we should begin to see an incredible upside price swing in Gold and Silver shortly after this date. You won’t want to miss this one – trust us. There will be time to catch this move when it starts – it could be an extended upside move.
Pay attention and put April 21st on your calendar now.
If you like our research and our level of insight into the markets, then take a minute to visit our site to learn how we help our clients find and execute for success. We’ve been calling these market moves almost perfectly over the past 18+ months. Learn how our research team can help you stay ahead of these swings in price and find new opportunities for skilled traders. Take a minute to see how we can help you find and execute better trades by visiting The Technical Traders today.
Chris Vermeulen
Technical Traders Ltd.
Labels:
Chris Vermeulen,
gold,
investing,
momentum,
palladium,
precious metals,
profit,
Silver,
The Technical Traders,
traders
Wednesday, February 7, 2018
Three Trades for This Wild Market
It has been an emotional ride for most traders since stocks started to sell off last Friday in a big way. This crash we just experienced is VERY much like the Aug 2015 crash. Price and volatility both have parabolic price movements that could either make you a lot of money or lose a bundle depending on where your money was positioned.
This post is to quickly share three recent trades we have taken one of them (REALLY BAD) and what to expect in the markets moving forward.
On Monday while the markets were under serious pressure cascading lower our only open position at the time was DUST. This is an inverse gold miners fund that allows us to profit when gold stocks fall in value. We had been expecting gold stocks to fall for a couple weeks and got into the position on Jan 26th. Gold stocks fell quickly and we took partial profits at 11% within 3 days.
We continued to hold the balance of DUST in anticipation of a second leg down in gold stocks which our technical analysis was showing should happen within a couple days which it did. On Monday, Feb 5th while stocks were under more selling pressure money rotated into the gold stocks as a safe haven and that is we decided to close the position with a 20% profit it 7 days. This was a good trade, but the next one isn’t.
Also, on February 5th we were anticipating the panic selling and looking for a washout low to be put in place Monday/Tuesday of this week. Thus far everything has played out exactly as we expected in terms of price action. What I love about technical analysis is that if done correctly you can predict, or at least have a very good idea of what price should do next, and because we knew panic selling was coming we were not totally caught off guard. But I will admit, I expected half the price movement and volatility that actually took place this time around.
* I always short UVXY when the vix is high, and fade the fear. But no shares were available to short Monday.
* The only other way to do this was to buy XIV and inverse VIX fund which works in most cases but not nearly as good as short selling UVXY.
* Volatility jumped 100% Monday, XIV fund imploded and lost 98% of its value catching hedge funds, professional traders, and us off guard.
* XIV is still trading, it will take many months to regain and reduce some of its draw down.
During extreme situations like XIV position dropping 98% there are two ways to deal with it. Take the loss and move on, or use the extreme market conditions to get back into a trade and catch the next big move to help minimize XIV draw down. So we took a short sell trade on UVXY Tuesday at the open. The VIX was set to gap sharply higher into a level it has only ever reached a few times in before. By shorting the VIX it means we profit when the VIX falls in value which it did.
We opened the trade right at the opening bell and the VIX when into free fall hitting our first profit target within 18 minutes for a 36% profit. We still hold half the position expecting a larger gain over the next few days. Currently, this short UVXY position is up over 50% and we are looking for roughly 70% before we close it out.
Take a listen to my audio Squawk Box broadcast today to subscribers to get a feel for the XIV, volatility, and the stock market.....Visit Here
CONCLUSION
In short, February has been exciting, to say the least. I feel this price action is a major warning and signal that the bull market is coming to an end. What I feel is going to unfold is similar price action we say from Aug 2015 crash – Feb 2016. Big price rotation, and elevated volatility. And this time, stocks may not find support at the lows created this week and trigger the first leg down in a new bear market.
It’s likely going to take most of 2018 to form and unfold, but we aware…
Join us at Technical Traders Ltd. Wealth Building Newsletter and take advantage of the next major trend changes and profit.
Chris Vermeulen
The Technical Traders Team
This post is to quickly share three recent trades we have taken one of them (REALLY BAD) and what to expect in the markets moving forward.
On Monday while the markets were under serious pressure cascading lower our only open position at the time was DUST. This is an inverse gold miners fund that allows us to profit when gold stocks fall in value. We had been expecting gold stocks to fall for a couple weeks and got into the position on Jan 26th. Gold stocks fell quickly and we took partial profits at 11% within 3 days.
We continued to hold the balance of DUST in anticipation of a second leg down in gold stocks which our technical analysis was showing should happen within a couple days which it did. On Monday, Feb 5th while stocks were under more selling pressure money rotated into the gold stocks as a safe haven and that is we decided to close the position with a 20% profit it 7 days. This was a good trade, but the next one isn’t.
Also, on February 5th we were anticipating the panic selling and looking for a washout low to be put in place Monday/Tuesday of this week. Thus far everything has played out exactly as we expected in terms of price action. What I love about technical analysis is that if done correctly you can predict, or at least have a very good idea of what price should do next, and because we knew panic selling was coming we were not totally caught off guard. But I will admit, I expected half the price movement and volatility that actually took place this time around.
Terribly Unfortunate Trade
* I always short UVXY when the vix is high, and fade the fear. But no shares were available to short Monday.
* The only other way to do this was to buy XIV and inverse VIX fund which works in most cases but not nearly as good as short selling UVXY.
* Volatility jumped 100% Monday, XIV fund imploded and lost 98% of its value catching hedge funds, professional traders, and us off guard.
* XIV is still trading, it will take many months to regain and reduce some of its draw down.
Tuesday's Clawback Trade
During extreme situations like XIV position dropping 98% there are two ways to deal with it. Take the loss and move on, or use the extreme market conditions to get back into a trade and catch the next big move to help minimize XIV draw down. So we took a short sell trade on UVXY Tuesday at the open. The VIX was set to gap sharply higher into a level it has only ever reached a few times in before. By shorting the VIX it means we profit when the VIX falls in value which it did.
We opened the trade right at the opening bell and the VIX when into free fall hitting our first profit target within 18 minutes for a 36% profit. We still hold half the position expecting a larger gain over the next few days. Currently, this short UVXY position is up over 50% and we are looking for roughly 70% before we close it out.
Take a listen to my audio Squawk Box broadcast today to subscribers to get a feel for the XIV, volatility, and the stock market.....Visit Here
CONCLUSION
In short, February has been exciting, to say the least. I feel this price action is a major warning and signal that the bull market is coming to an end. What I feel is going to unfold is similar price action we say from Aug 2015 crash – Feb 2016. Big price rotation, and elevated volatility. And this time, stocks may not find support at the lows created this week and trigger the first leg down in a new bear market.
It’s likely going to take most of 2018 to form and unfold, but we aware…
Join us at Technical Traders Ltd. Wealth Building Newsletter and take advantage of the next major trend changes and profit.
Chris Vermeulen
The Technical Traders Team
Labels:
Chris Vermeulen,
dust,
Gas,
gold,
Oil,
panic selling,
profit,
Technical Traders,
traders,
UVXY,
VIX,
volatility,
XIV
Wednesday, December 20, 2017
Today's Gap Fill and Prediction Complete, What's Next?
Subscribers of our Technical Traders Wealth Building Newsletter were told before the market opened that stocks were set to gap higher and then fill the price gap. Only 12 minutes after the market opened the gap window was filled for a 9.5 pt move in the SP500, which is a quick $475 profit for those trading futures, or $103 profit per 100 shares traded of the SPY ETF.
If you want to know what the market are going to do today, this week, and next month be sure to subscribe to our new and improved market trend forecast and trading newsletter....
Visit "The Technical Traders ETF Cycle Trader" Right Here
Yesterdays Gap Fill Forecast
If you want to know what the market are going to do today, this week, and next month be sure to subscribe to our new and improved market trend forecast and trading newsletter....
Visit "The Technical Traders ETF Cycle Trader" Right Here
Labels:
Chris Vermeulen,
etf,
gap,
Gas,
gold,
investing,
Market,
newsletter,
Oil,
profit,
SP500,
The Technical Traders,
trader
Thursday, November 30, 2017
Capital Repositioning Driving Volatility Higher
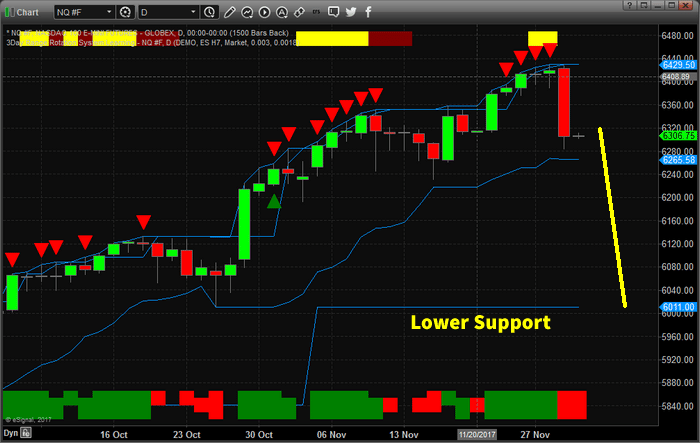
Recent moves in the FANG stocks shows that capital is starting to reposition within the global market. As the end of the year approaches, expect more of this type of capital control to drive greater volatility within the markets. At this time of year, especially after such a fantastic bullish run, it is not uncommon to see capital move out of high flying equities and into cash or other investments.
The recent move lower in the NQ has taken many by surprise, but the bullish run in the FANG stocks has been tremendous. Facebook was higher +59% for 2017 (600% 2016 levels). Amazon was up +61% for 2017 (550% 2016 levels). Netflix was up +64.75% for 2017 (600% 2016 levels) and Google was higher by +37% for 2017 (1000% 2016 levels). These are huge increases in capital valuation.
In early 2017, we authored an article about how capital works and always seeks out the best returns in any environment. It was obvious from the moves this year that capital rushed into the US markets with the President Trump’s win and is now concerned that the end of the year may be cause to pull away from the current environment.
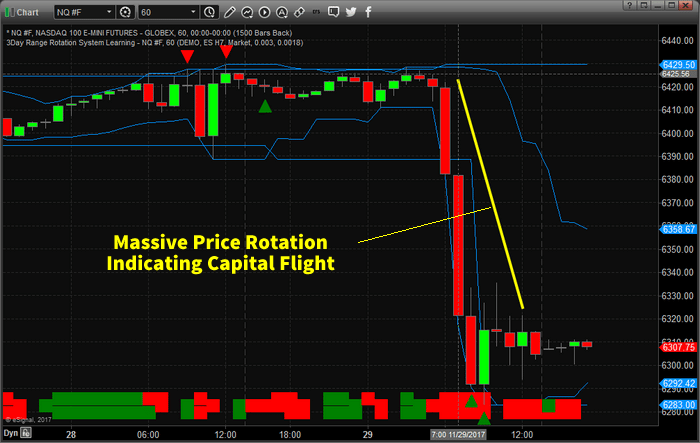
The current decline in the NQ, -2.25% so far, is not a huge decline in price yet. Lower price support is found near the $6000 level. Should this “Price Flight” continue in the NASDAQ, we could be looking at a 6~8% decline, or greater, going into the end of this year.
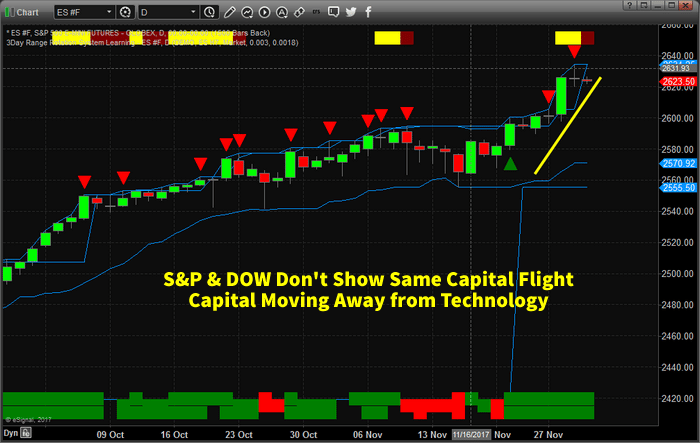
The price swing, this week, was very fast and aggressive. In terms of capital, this was a massive price rotation away from Technology. While the S&P and DOW Industrials continue higher, this presents a cause for concern with regards to the end of year expectations.
Will capital continue to rush into the US markets and specifically Technology stocks? Or will capital rush out of these equities and into other sources of “safety” as technology melts down into the end of 2017? Has the 40~60%+ price rally of 2017 been enough for investors to take their profits and run?
It is quite possible that capital will move to the sidelines through the end of this year and reenter the markets early next year as investors find a better footing for the markets. The facts are, currently, that financials and transportation seem to be doing much better than the FANG stocks. If this continues, we could be looking at a broader shift in the global markets – almost like a second technology bubble burst.
If you want to learn more about how we can assist you with your investment needs, visit The Technical Traders Here to learn more. Our researchers are dedicated to assisting you and in helping you learn to profit from these moves. 2018 is certain to be a dynamic trading year – so don’t miss out.
Labels:
Amazon,
bullish,
capital,
equities,
Gas,
investment,
NASDAQ,
Oil,
President Trump,
profit,
Technology,
trading
Thursday, July 13, 2017
Momentum Reversal Method Strikes Again with MOBL
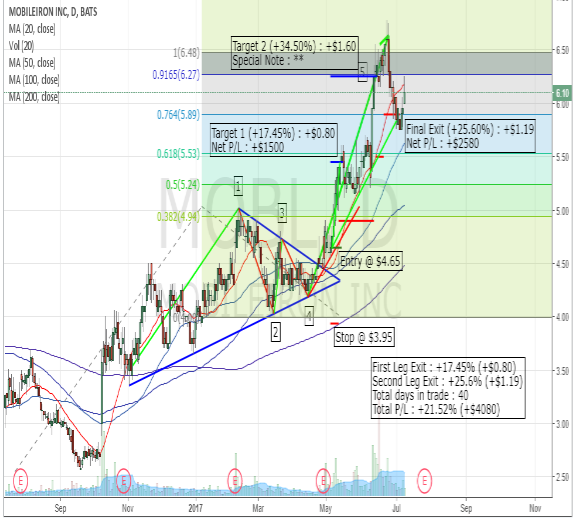
In early May, 2017, we alerted our followers to a trading opportunity that resulted in a nearly perfect Momentum Reversal Method (MRM) setup – this trade was MOBL (Mobileiron Inc). Now that the trade has completed, we wanted to share with you an example of how the MRM trading strategy works and how successful some of these setups can become. But first, lets take a bit of time to understand what Active Trading Partners is and how we provide benefit and services to our clients.
Active Trading Partners is a research and analytics firm that specialized in US Equities, ETFs and major Commodities analysis. Our objective is to continually provide updated research and analytics for our members as well as to actively deploy our specialized Momentum Reversal Method (MRM) trading strategy for our members use and benefit. As many of you may remember, on June 11 2017, we posted our research that the “NASDAQ would sell off” and the “VIX would SPIKE” on or near June 29th, 2017. How many of you would have loved to know that we predicted a 6% swing in the NASDAQ and a 52% swing in the VIX two weeks in advance on the EXACT DAY it happened?
What we are trying to illustrate to you is that we attempt to provide value beyond our trading signals and beyond our daily updates. We attempt to keep you aware of what is likely to happen in the global markets and how these swings can be advantageous for you as traders/investors. So, before we get sidetracked on the extras we provide, lets focus on this MOBL trade.
MOBL began to appear on our MRM alerts in early April 2017. As with many of the MRM type of setups, they begin can sometimes start to alert us to setups days or weeks in advance of the actual move. In this case, classic technical and Fibonacci analysis assisted in confirming our MRM trigger. The MRM setup was valid and we simply wanted to watch the MRM setup for signs of price volume/rotation. We often use this price/volume rotation trigger as a means of setting up entry functions for pending MRM triggers.
In early May 2017, the price/volume rotation trigger was complete and now we had a valid entry into MOBL with projected targets of $5.45 and $6.25. Our analysts identify the targets based on recent price action, where our entry is located and current price/volume rotation levels. In other words, if we believe the move will be short term, then we will adjust our targets to focus on immediate objectives. If we believe the move will be a bit longer-term, then we will adjust our targets to focus on that objective.
Just to be clear, everything originates from the MRM trigger. We may see 20 or 30 of these triggers each week. From there, price confirmation MUST occur or have already happened in order for it to be considered for our ATP members. Additionally, we attempt to gauge the overall global markets in terms of risk parameters for each MRM setup/trigger. If the US majors or global markets are weak and fearful, then we’ll address that risk by being more selective of our MRM triggers and setups. If our analysts believe the US and global markets are going to continue to trend, then we may widen our risk parameters a bit more.
On May 11th, 2017, we issued a BUY Swing Trade Alert for MOBL @ $4.65 for a FULL Position. This exact alert read as follows:
Buy Symbol : MOBL
Max Buy Price: $4.85 or lower
Position Size: FULL
Stop loss: Close below $3.95
Target: $5.45, then $6.25 objective for a 17~35%+ swing potential
Max Buy Price: $4.85 or lower
Position Size: FULL
Stop loss: Close below $3.95
Target: $5.45, then $6.25 objective for a 17~35%+ swing potential
Enter FULL position below $4.85 today. A move above $5.35 is expected with a potential for a move above $6.50 later.
As you can see from these charts, we executed the MOBL trade flawlessly. The first target was hit only 6 trading days after entry for a +17% gain. The second target took a bit longer, but it was eventually hit 26 trading days after entry (about one month after entry). It was just prior to the second target being hit that our research team indicated that MOBL could run much higher and that we should alert our members that we are going to use Target #2 as a stop adjustment and attempt to let this position run. Typically, we get about 2~4 of these types of trades each calendar year for our members – you know, the big breakout runners that can turn into 30%, 50%, 120% or more.
When all was said and done, Our VIX/NASDAQ analysis was perfect and the rotation in the tech markets resulted in our MOBL trade getting stopped out July 3rd, 2017 @ $5.85 for a +25.6% gain.
This single trade resulted in a +$4000 total return for our members – this one trade will cover their ActiveTradingPartners.com membership for almost FOUR YEARS. Believe it or not, we are expecting MOBL to generate another MRM setup soon that could allow us to re-enter this trade for the next run higher.
This is an excellent example of how our Momentum Reversal Method strategy works and provides benefits for our clients. Not only do you receive these timely and accurate triggers, but you also receive our advanced research and market analysis. Like we said early, we alerted our members to a critical June 29th market move two weeks before it happened and our analysis hit perfectly. We like to ask our clients and viewers this question, “isn’t it time you invested in your future?”. We would really like to help you achieve greater success and find greater opportunities in the markets, but you have to subscribe at Active Trading Partners .com for this to happen.
Isn’t it time you invested in quality, logical trade research your future? CLICK HERE TO JOIN
Chris Vermeulen
aka the Gold and Oil Guy
Chris Vermeulen
aka the Gold and Oil Guy
Labels:
Active Trading Partners,
Chris Vermeulen,
entry,
gold,
MOBL,
Momentum Reversal Method,
MRM,
profit,
strategy,
triggers
Monday, June 12, 2017
FREE workshop....Big Profits from Breakouts & Mega Trends
We are excited to announce that this Thursday our friends Todd and Roger will be putting on a New FREE LIVE interactive trading workshop, where we’ll teach you how to incorporate Bollinger Bands and Price Envelopes into your trading for much bigger gains which will help you maximize the percentage of winning trades you take while decreasing your losses significantly.
See you in the markets,
Ray @ The Crude Oil Trader
P.S. I recommend you attend this class if you're interested in learning trading strategies you can incorporate into your trading right away. We anticipate this workshop will be fill up very quickly so get your reserved seat asap.
They have decided to call this workshop "Big Profits from Breakouts and Mega Trends". You’ll also learn an ETF trading model that generated Todd over 963% return in just over 6 years.
Click here to REGISTER Thursday June 15th at 4:30 ET
It’s FREE to attend and it’s going to be actionable trading strategies you can start using the very next day!
Here’s just a few of the actionable strategies you’re going to learn:
* How To Use Bollinger Bands and Price Envelopes for Profitable Breakouts
* How Professional Traders Use Trailing Stops to Ride Massive Trends
* The Rules to the Turtles Trend Following System That Made Billions Over the Past Decade
* How to avoid Massive Losing Periods That Come With Buy and Hold
* How to Take Advantage of Increased Volatility So You Can Lock in Profits with Trailing Stops
* You’ll be Introduced to an ETF Trading Model That Generated Over 963% Return In Just Over 6 Years!
PLUS…Learn a lot more and get ALL your questions answered LIVE!
I couldn’t be more excited to have Todd and Roger show you firsthand how an ex hedge-fund manager with tremendous success and experience trades the markets.
Have a profitable day we hope to see you there!
See you in the markets,
Ray @ The Crude Oil Trader
P.S. I recommend you attend this class if you're interested in learning trading strategies you can incorporate into your trading right away. We anticipate this workshop will be fill up very quickly so get your reserved seat asap.
Labels:
Bollinger Bands,
breakouts,
buy,
etf,
hold,
profit,
stocks,
stops,
strategies,
Todd Mitchell,
Trends,
volatility
Tuesday, January 12, 2016
Steve Swanson Shows Us How to Trade This Volatile Market
Steve Swanson's 4D technology [which you'll read about in a minute] predicted everything about January's sell off and subsequent rally way back in December. If you want to know the future too, just click on the video link below. An up to date chart of the S&P 500 Price/Time Continuum is posted below the video. See for yourself the precise day the next big rally will begin then use the profit magnifier detailed in this free eBook to earn 3 times more profits.
A revolutionary profit magnifier quietly introduced in November 2008 had the power to essentially change the fate of millions of beleaguered investors. Yet, to this day hardly anybody knows about it. Do you? In his highly acclaimed new book, Steve Swanson [the brilliant trader and inventor who predicted every intermediate market top and bottom for more than two decades] reveals a safe and easy way for you to utilize the powerful Thanksgiving gift of 2008 to earn 3 times more money on every trade.
This is something you really deserve to know about. And you can download his tell all new ebook this week for free. Just for starters, see how you can take that profit and triple it! See how this one simple change can earn you 3 times more money I was shocked. And I think you will be too when you see how ridiculously simple it is to make one minor change. Easy for anybody. And turn a boring 25% a year strategy into an exciting moneymaker that averages 108% a year with no compounding!
And that’s not all. When you download your FREE eBook, you’ll also gain instant access to Steve’s paradigm shifting video
Steve Swanson actually invented a program that plots every intermediate market high and low. Past, present, and future on what’s called the “Price Time Continuum”. That’s how he’s been able to predict and profit from every market turning point for more than 2 decades. Some are calling Swanson’s 4th Dimension breakthrough the “Discovery of the Century”.
See you in the markets,
Ray C. Parrish
aka the Crude Oil Trader
P.S. As with most free things, Steve Swanson’s generous offer is limited. So, even if you don’t have time to delve into anything new right now, I’d encourage you to grab your free ebook while you can. That way you’ll have it to look through whenever you like. Click Here Now.
Monday, October 5, 2015
This Weeks Class "Beginners Guide to Directional Income Trading Bear Markets"
With markets clearly moving into bear market territory our timing couldn't be better this week. We have our trading partner Bruce Marshall of Simpler Options showing us how the trading methods he is using during this "correction" in the market.
So join us this Wednesday, October 7th from 8:00 – 10:00 pm est.
Sign Up Here
In this training class Bruce will share.....
* How to profit from the huge swings in volatility
* How to structure a trade to take advantage of gap downs in the market
* How to structure a trade to get a positive theta decay on your bearish trades
* Step by step how to put on and take off the trade with profit targets
* How to avoid the common mistakes in trading a down market
* You will also receive an online recording after the class
There is limited seating for this event so Click Here to Get Your Seat ASAP
See you Wednesday night!
Ray C. Parrish
aka the Crude Oil Trader
Labels:
Bruce Marshall,
class,
decay,
John Carter,
Market,
options,
profit,
Simpler Options,
volatility
Monday, September 14, 2015
ENCORE: Here's a Second Chance to Attend John's LIVE Event
If you missed last weeks event with our trading partner John Carter of Simpler Options you get another chance to catch this free webinar LIVE this Tuesday evening September 15th at 8 p.m. est. [now a replay]
Last weeks event was over prescribed so those that logged in late lost their seat to the those on the waiting list. Don't let that happen again. Please reserve your seat asap and make sure you log in 10 minutes early on Tuesday night so you don't lose it.
Watch the "500k Proof and Trading Plan" Webinar Replay
Even if you attended last week you might try to get another spot this week as John has added even more examples of how to put these methods to work right away. John is a special trader for sure, and what really sets him apart is his ability to pass on his skills. He has a "knack" for making his trading methods easy to understand so you can put them to work the following trading day.
Watch the new video John has put together to get ready for this class.....Watch it HERE
John became famous for the "Big Trade" he made on Tesla, ticker TSLA in 2014. And in the process changed the way wall street looks at using options for protection and profit. And this weeks webinar will make it clear, it's not an unattainable thing to trade like John. And he will deliver this Tuesday, that's why we are going and that's why we believe you should as well.
Register for live event and secure recording HERE [Now a Replay]
See you Tuesday evening,
Ray C. Parrish
aka the Crude Oil Trader
Get our latest FREE eBook "Understanding Options"....Just Click Here!
Saturday, September 5, 2015
This Weeks Free "500k Proof and Trading Plan" Webinar with John Carter
We will be attending an live online event this Wednesday evening with
John Carter and we would love to have you join us. Please reserve your seat asap since John's wildly popular webinars fill up quickly.
Sign Up for the "500k Proof and Plan Webinar"
John is a special trader for sure, and what really sets him apart is his ability to pass on his skills. He has a "knack" for making his trading methods easy to understand so you can put them to work the following trading day.
John became famous for the "Big Trade" he made with Tesla [TSLA] in 2014. Changing the way wall street looks at using options for protection and profit. And this weeks webinar will make it clear, it's not an unattainable thing to trade like John. And he will deliver this Wednesday, that's why we are going and that's why we believe you should as well.
Register for live event and secure recording HERE
See you Wednesday evening,
Ray C. Parrish
aka the Crude Oil Trader
Get ready for Wednesdays with John's latest FREE eBook "Understanding Options"....Just Click Here!
Wednesday, August 5, 2015
The Next Big Bull Run....Can you guess what sector we are talking about?
There’s a tiny sub sector of the market that explodes in value every 5-10 years.
* In the late 70’s some investors saw gains of 2,464%, 13,025%,
and 3,479%.
* In the mid 80s there were gains of 5,445%, 7,650%, and 7,011%.
* And in the early 90s and mid 2000s we saw 3,050%, 2,431%, and
2,054% gains.
These numbers are simply incredible.....
Our trading partner Doug Casey is telling us that right now the sector is once again ripe for huge gains. I strongly encourage you to check this situation out. You might not get the chance again for another decade. The profit potential on this opportunity is so high and so explosive that we would be a little disappointed if it was “only” good for 500% gains.
I believe the next huge rally in this sector is right around the corner.
And to help you beat the flood of investors that will rush into this investment once the bull run starts, Doug and his staff, the analysts at Casey Research, have put all of their research online, visit here.
I strongly encourage you to check it out....visit the "Casey Research Group"
See you in the markets,
Ray C. Parrish
aka the Crude Oil Trader
P.S. This is by no means “cherry picking” the best gains from these rallies. Here’s a better list of some of the gains investors saw when this unique sector went on a tear.
Stock #1 up 26,040%
Stock #2 up 4,376%
Stock #3 up 1,874%
Stock #4 up 1,850%
Stock #5 up 1,827%
Stock #6 up 5,692%
Stock #7 up 2,431%
Stock #8 up 3,090%
Stock #9 up 3,050%
Stock #10 up 1,400%
Stock #11 up 1,600%
Stock #12 up 971%
Stock #13 up 2,464%
Stock #14 up 1,567%
Stock #15 up 13,025%
And there’s many, many more. Get the story behind these huge gains right here!
Labels:
casey research,
Doug Casey,
gains,
investment,
investors,
Market,
profit,
sector,
stocks
Wednesday, October 1, 2014
Everything You Need to Know About the SP 500 Until Christmas
By Andrey Dashkov
When I need to clear my mind, I put on my beat up Saucony sneakers and drive to nearby Deer Lake Park in Burnaby, British Columbia. After a couple of miles, though, as my body gets into a rhythm, my mind wanders back to the thought that occupy it for hours each day: where will this market go next?And I’ve thought a lot about what went on this summer. Since June 1st:
• S&P 500 is up 2.7%, having set a new record high in September;
• MSCI World index is down 0.5%;
• 10 year Treasury yield is down from 2.54% to 2.50%;
• Brent Crude 0il is down 12.8%; and
• Gold is down 2.2%.
The stage seems to be set for the fifth straight year of positive economic growth in the US; however, we’re always cautious about government supplied information, especially during an election cycle.
At the moment, macro developments seem closely intertwined with stock market performance. Instead of slumping, the market was rather vibrant this summer. The S&P 500 showed resilience, reaching higher highs after a dip in late July and early August that coincided with increased uncertainty surrounding the Ukrainian crisis.
Geopolitics aside, the market was supported by GDP growth, which in turn was underpinned by strong corporate profits and margins. In fact, in the second quarter, the S&P 500 set a new record for profit margins: 9.1%. So much for “sell in May and go away.”
Expanding earnings and margins are great news on the fundamental front. Of the trends we observed this summer, at least two will benefit S&P 500 companies’ profitability. Cheaper oil may keep energy costs down, while consumers are more than willing to swipe their debit and credit cards. In August, consumer confidence jumped to its highest level since October 2007, having increased for four months in a row.
Loose Money Helping Stocks in the Short Term
In the first quarter, 290 companies from the S&P 500 bought back shares at a cost of $159.3 billion, 59% more than a year ago. Dividends are up as well: in the first quarter, S&P 500 companies spent a record $241.2 billion on dividends and repurchases together, according to Standard & Poor’s.
Second quarter share repurchases were estimated at $106 billion, according to Financial Post. That’s much lower than first-quarter repurchases (though the official numbers aren’t out yet) and down 10% year on year.
Buyback Frenzy Is a Net Positive for Share Prices
The chart below tracks the S&P 500’s median dividend yield since the first quarter of 2009.
The median dividend yield decreased just slightly over this period: from 1.9% in 1Q09 to 1.7% in 2Q14, and it’s held relatively steady over the past three years.
The good news is that S&P companies aren’t stretching their balance sheets too thin to cover these dividend payments—these payments are backed by earnings. The median dividend payout ratio (the ratio of dividends paid to net income), although up from five years ago, still looks solid.
S&P companies can successfully cover their dividends with earnings, so there’s no reason to fear that they’ll have to borrow to keep paying them. However, a lot of investors worry about leverage. On one hand, financial leverage boosts return on equity (ROE), and prudent borrowing can be a positive for investors. On the other hand, large amounts of leverage leads to volatility in earnings, a less stable balance sheet, and risk that affects valuations.
Debt and Cash Both Up
Debt and cash grew at about the same pace during the last couple of years. There were many reasons for this trend, but two interrelated ones stand out: the abundance of cheap debt that S&P companies took advantage of (why spend your own cash when you can finance on such great terms and pay it back over a long period?); and the desire to keep interest on that debt as low as possible by making credit rating agencies happy and holding a lot of cash in the bank.
If a correction is in the cards for the near term, this cash, increased earnings, and the support coming from share buybacks will provide some cushion for these companies’ valuations.
Why We’re Not “Permabears”
I’m not saying the rising market is somehow “wrong.” There are solid company level fundamentals and positive macro-level data points here and there that support a significant part of its growth.
Your Plan to Profit
What matters is that even in this situation you can protect your financial well being by sticking to our core strategy: diversify geographically and across sectors; and invest in assets that provide robust yield relative to risk and have the potential to rise in price. You can learn more about the Miller’s Money Forever core strategy here—a time-tested plan designed for seniors, savers and like-minded conservative investors.
The article Everything You Need to Know About the S&P Until Christmas was originally published at millers money.
Make sure to get our latest FREE eBook "Understanding Options"....Just Click Here!
Saturday, August 9, 2014
Trading ETF'S for Profit, Protection and Peace of Mind ....our next FREE webinar
Our readers have asked if our trading partner John Carter could do for them, the average trader and long term investor, what he has done for the advanced options traders. And John has responded with a complete new program, the Simpler Stocks Trading program, complete with his wildly popular free trading webinars.
John gets the program started with our first webinar in the series, "Trading ETF'S for Profit, Protection and Peace of Mind", on Tuesday August 19th at 8 p.m. est.
Click Here to Get Your Reserved Space
In this Free Webinar John Carter is going to share:
* How you can add high probability trading technique that you can use on small to large accounts the next trading day
* Why ETFs have a strategic advantage over any other market you’re trading
* Why ETFs can be used to create steady winning trades for your trading account
* Why ETFs help you avoid being impacted by high frequency traders that are manipulating other markets
* How to trade ETFs to generate consistent income within your own personal risk profile
Get your seat for our next free webinar "Trading ETF'S for Profits, Protection and Peace of Mind"....Just Click Here!
Labels:
ETF's,
John Carter,
options,
profit,
Simpler Stock Trading,
stocks,
webinar
Subscribe to:
Posts (Atom)