Showing posts with label capital. Show all posts

Sunday, January 26, 2020

The Black Swan Event Begins

As the Asian markets opened on late Sunday, traders expected a reactionary price move related to the threat of the Wuhan virus and the continued news of its spread. The U.S. Dow Jones futures markets opened close to -225 points lower on Sunday afternoon and were nearly -300 points lower within the first 25 minutes of trading. Gold opened $10 higher and continued to rally to a level above $15 higher.

If this is early price activity, or a reactionary price move, related to fear of what may come, then the warnings signs are very clear that global traders and investors believe this virus outbreak may very well turn into a major Black Swan event.

Our research team believes a 5% to 8% rotation should be considered a normal reversion range where price may find immediate support and attempt to rally from these support levels. Anything beyond 10% may set up a much bigger price reversion event, something akin to a Black Swan event. Therefore, we are advising our friends and followers to take the necessary steps to protect your wealth and assets as this move continued to extend.

30 Minute YM Futures Chart 

This 30 minute YM futures chart highlights the reactionary downside price move (GAP) taking place on the open of the Asian markets. This GAP lower may be just the beginning of a much broader downside price move. We are going to have to wait and see what happens related to the Wuhan virus over the next 14+ days.


30 Minute Gold Futures Chart

Gold shot up nearly 1% in early trading on Sunday. Fear is driving investors to pile into the precious metals markets. As news of this virus continues to hit the news cycle, we expect metals will continue to push higher and higher – likely targeting the $1750 level in Gold.

If you want to see what the big money players own check out these gold charts and a very different interpretation of the gold COT Data here.


If you have not been following our research and if you have not already positioned your portfolio for this potential reversion event, then now would be a good time to start taking action. Do some research on the 1855 Third Plague Event in China where more than 15 million people died (nearly 1.25% of the total global population at the time). If those levels hold for this event, then possibly 60 to 80 million people may die over related to this event.

Crude oil is collapsing again and just his out downside target of $53. Our energy sector trade idea is up over 15% already.

Remember, all of this is speculation at this point. Yet we urge traders to act now to take action to prevent further erosion of their wealth and retirement accounts. Visit the Technical Traders website to learn how we can help you plan for these events, protect your wealth, and find great trades.

As a technical analysis and trader since 1997 I have been through a few bull/bear market cycles, I have a good pulse on the market and timing key turning points for both short term swing trading and long-term investment capital. The opportunities are massive/life changing if handled properly.

Join my Wealth Building Newsletter if you like what you read here and ride my coattails as I navigate these financial markets and build wealth while others lose nearly everything they own.

Chris Vermeulen
The Technical Traders


Stock & ETF Trading Signals

Friday, November 29, 2019

100% Measured Moves May Signal a Top

One type of Fibonacci price structure we use to attempt to measure price trends and identify potential tops/bottoms is the “100% Measured Move” structure. This is a price structure where a previous price move is almost perfectly replicated in a subsequent price trend after a brief period of retracement or price correction. These types of patterns happen all the time in various forms across multitudes of symbols to create very solid trading signals for those that are capable of identifying trends and opportunities using this technique. If you want my daily analysis and trade ideas, be sure to get my updates by joining my free trend signals email list.

The first thing we look for is a strong price trend or the initially confirmed reversal of a price trend. We find that these trending price ranges and initial “impulse trends” tend to prompt 100% measured moves fairly accurately. The explosive middle trend is where one can’t assume any type of Fibonacci 100% measured move will happen. Those explosive moves in a trend that tend to happen in the middle of a price trend are what we call the “expansion wave” of a trend and will typically be 160% or more the size of the initial impulse trend.

These trade setups we call the “100% measured moves” are naturally occurring price rotations that skilled traders can use to identify strong trade potential setups. They are more common in rotating markets where a moderate trend bias is in place (for example in the current YM or ES chart).

First, let’s take a look at this YM Weekly Chart to highlight the most recent 100% Measured Move. The original upside price move between June 2019 and July 2019 resulted in a 2787 point price rally that replicated between August 2019 and November 2019 – after a brief price retracement. Currently, price is rotating near the peak of this 100% measured price move near 27,875 while attempting to set up a new price trend.


In this ES Weekly example chart, we see a 100% Measured Move that originated in June 2019 and ended in July 2019 – just like on the YM chart. Although the completion of the 100% measured move didn’t originate until the low that formed before price rallied to take out the previous high near 3029.50. Remember, the other facets of Fibonacci price theory are also still at play in the markets while these 100% Measured Moves are taking place. Thus, rotation between a previous price peak and valley (without establishing any new price highs or new price low) are considered “price rotation” – not trending. The 100% Measured Move that did take place recently did complete a full 100% advancement and is now stalling near the 3040 level peak.


If you are not familiar with some of my forecasting and trading strategies for trading the S&P 500, or my gold trading signals be sure to click those links to see some pretty interesting charts like these.

SP500 Index Trend Identification and Trade Signal System


Cycle and Price Prediction System


Concluding Thoughts

Once these 100% measured moves complete, price usually attempts to stall or wash out a bit before attempting to establish a new price trend. At this point, given the examples we’ve illustrated, we believe the US market will enter a period of rotation and moderate volatility as these 100% measured moves have completed the upside price advance for now. Some level of price rotation after these 100% measured moves have completed will potentially allow for another attempt at a future 100% price advance after setting up a new price leg.

These techniques don’t always work, we recently got stopped out on a TVIX (vix/volatility trade for a loss) but we just close out our thirst natural gas trade for a quick 7% profit. The previous UGAZ trade netted 20%, and the one before that was 7.95%.

I can tell you that huge moves are about to start unfolding not only in metals, but stocks, and currencies. Some of these supercycles are going to last years. Brad Matheny goes into great detail with his simple to understand charts and guide about this. His financial market research is one of a kind and a real eye-opener. PDF guide: 2020 Cycles – The Greatest Opportunity Of Your Lifetime

As a technical analysis and trader since 1997, I have been through a few bull/bear market cycles. I believe I have a good pulse on the market and timing key turning points for both short term swing trading and long term investment capital. The opportunities are massive/life changing if handled properly.

I urge you to visit my Wealth Building Newsletter and if you like what I offer, join me with the 1 or 2 year subscription to lock in the lowest rate possible with our BLACK FRIDAY offer, PLUS get a FREE BAR OF GOLD and ride my coattails as I navigate these financial markets and build wealth while others lose nearly everything they own during the next set of crisis’.

Chris Vermeulen
The Technical Traders


Stock & ETF Trading Signals

Saturday, February 16, 2019

Here We Go - Get Ready for the Breakout Pattern Setup

We are writing this post today with a few forward-looking expectations while attempting to warn traders that some extended rotation is likely to enter the markets over the next 30+ days. If you’ve been following our research, you’ll know that we’ve been calling these move months in advance of other researchers and analysts. Our September 17, 2018 research post highlighting our Adaptive Dynamic Learning predictive modeling system suggested the U.S. stock markets were poised for a massive price rotation followed by a very unique price setup that we are experiencing now.

Currently, the YM (Dow Futures Contracts) are leading the pack on a dramatic upside breakout move. This is likely a result of the US government spending bill that is recently working its way towards approval and the fact that this new spending bill clears the way for at least 8+ months of uninterrupted market optimism (or at least we hope). This 300+ point upside move clearly breaks price highs and puts the U.S. stock market, at least the Dow/Blue-Chips, back into “new high trending mode”. As many of you are likely aware, our Fibonacci price study teaches us that price must ALWAYS seek to establish new price highs or new price lows AT ALL TIMES. Thus, these new price highs are a very strong indication that the upside trend is dominant and should continue for a while.


Additionally, we want to highlight what we believe will be a similar price pattern to 2015/2016 in the U.S. markets – a multiple Price Wedge formation that could ultimately set up another price leg (which we believe will be higher, to the upside, at this time).

In the next article “PART II” pay close attention to the charts and images as we are attempting to clearly illustrate how and why price rotation is about to hit the US markets and why you need to be prepared for this move.

We continue to read that large amounts of capital are sitting on the sidelines or have been pulled from the markets over the past 12+ months. We understand this as the rotation in early 2018 frightened many investors and the continued sideways price action, global market concerns and geopolitical issues have caused international investors to want to protect their investments from risk – thus they move their capital into cash. We get it. But we also believe the next breakout in the U.S. markets will be a great opportunity for skilled traders to identify and prepare for an incredible profit potential no matter which way the market breaks up or down because technical analysis allows us to closely follow the direction of the market.

The amount of capital that is sitting on OUTSIDE the markets, currently, represents a massive amount of resources that could re-enter the markets when traders/investors decide the timing is right. We’ve termed this a “Capital Shift”.

In simple terms, it reflects capital/cash moving from one market to another or from actively invested to cash, then back to actively invested. Our belief is that capital operates in a manner to always protect itself from risk while attempting to identify suitable returns. The best environment for capital is always a relatively safe investment with protective values and a high probability of decent returns. Therefore, this massive amount of capital not being deployed in the global markets will, at some time, re-enter the markets and will likely increase pricing valuations.

How and when will this capital re-enter the markets? What will price activity look like and how will we know when the timing is right for our own strategic deployment of our trading capital? Continue reading to learn why we believe we are only 30~45 days away from an incredible trading setup. You won’t want to miss this one.

Please take a minute to visit The Technical Traders to learn how we can help you find and execute better trade in 2019 and stay ahead of these market moves. We are confident that you will find our Daily Video, Detailed Market Research, Proprietary Research Tools and Detailed Trading Signals will help you make 2019 an incredibly successful year.

Chris Vermeulen
Technical Traders Ltd.


Stock & ETF Trading Signals

Monday, June 11, 2018

Here’s Why We See the G7, Central Banks and U.S. Fed Will Drive Stock Prices this Week

After last weeks closing bell for stocks and the early signs of the Capital Market Shift which we mentioned previously was taking place are now clearly evident. We wanted to alert all of our followers that this week could be very dramatic with a number of key events playing into global expectations.

Our research team at Technical Traders Ltd. have been combing through the charts trying to find hints of what may happen and what to expect in terms of price volatility next week. We know our ADL price modeling system is telling us that certain price weakness will continue in certain sectors and strength in others – but we are searching for the next opportunities for great trades.

One of the key elements of the G7 meeting is the continued communication regarding global participation in key infrastructure projects and national cooperation in regards to economic stability.

Over the past 8+ years, the bulk of the global recovery has been based on the US economic stability and recovery. US interest rates allowed for a global “carry trade” that supported a large component of the economic bias in foreign countries. Additionally, the deeply discounted U.S. bonds provided a “fire sale” opportunity for many countries to secure U.S. Treasuries at a time when global central banks were printing cash to support failing economies. Overall, the economic conditions from 2009 to 2015 were such that every opportunity was provided to the global markets to make it easier to attempt a proper recovery.

Some nations were able to capitalize on this environment while others squandered the opportunity to create future growth, capabilities and new opportunities for success. Given the current global market environment, we expect some harsh comments to come from the G7 meeting as well as some wishful thinking comments. Overall, we believe the outcome of the G7 meeting will become a defining moment for the remainder of the year in terms of global economic expectations and forward intent. It will certainly be interesting to see how these leaders decide to operate within the constructs of the ever changing global market liabilities to say the least.

Right now, a lot of concern has been directed towards the Emerging Markets and what appears to be a near term market collapse. Debt spreads and global indexes have been moving in a pattern that clearly illustrates the Central Banks problems in containing the diverse economic conditions throughout the globe. Infrastructure projects, social/political shifts and currency valuations are complicating matters by creating extended pressures in many global economies recently. All of this centers around the strength of the U.S. economy and the US dollar as related to expectations and valuations of other foreign economies and currencies.

Almost like a double edged sword, as the U.S. economy/dollar continues to strengthen, foreign capital will migrate into these US assets because of the inherent protection and gains provided by the strength and growth of these markets. While at the same time, the exodus of capital from these foreign markets create a vacuum of value/capability that results in a continued decline in asset valuations and more.

Almost like the 1994 Asian Currency Crisis, the more the US economy strengthens, the more pressures the global markets feel as valuations and assets become more risky to investors. As investors flee this risk, they search for safe returns and value that is found in the US economy/Dollar – driving US equities higher and strengthening the US Dollar. It is a cycle that will likely continue until some equilibrium point is reached in the future.

The US markets are on a terror rally because global capital is searching and seeking the greatest returns possible – and the only place on the planet, right now, that is offering this type of return is the US economy and the US equities market. Our recent research shows that the NASDAQ indexes may stall and rotate over the next few months as price valuations have accelerated quite far and because the blue chips are relatively undervalued at the moment. This means, capital will likely continue to pour into the S&P and DOW heavyweights as this capital shift continues to play out.

The G7 meeting, in Toronto, this week will likely present some interesting outcomes. Early talk is that the G6 nations (minus the US) may enact some deal that they believe would be suitable for these nations going forward. Our concern is not the deal or the threat of these nations trying to engage in some deal without the US – far from it. Our concern is that their wishes may be grandiose and ill timed given these currency and valuation issues.

Imagine, for a second, the G6 nations engage in some grand scheme to engage in something to spite the USA. Some plan that seems big and bold and over the top. Yet, 5 months from now, debt issues plague these nations, currency valuations have destroyed any advantage they may have perceived they had and the member nations are beginning to feel the pressures of their own entrapment. What then? The USA to the rescue....again?

Recently, Ben Bernanke, a Senior Fellow at The Brookings Institute, warned that Donald Trump’s economy was like a Wile E. Coyote going over a cliff. Everything seems well and fine till the road ends and the cliff begins. I would like to remind all of our readers that The Brookings Institute does not have a stellar record of predicting much of anything over the past 10+ years. Take a look at this graph showing the economic expectations and predictions from The Brookings Institute over the past decade or so. Do these people seem capable of accurately predicting anything regarding the U.S. or global economy?


Now, ignoring all of the what if scenarios that are being presented by different people. The bottom line is that the next 6+ months are going to be very exciting for traders and investors. There are huge issues that are unfolding in the global economy right now. Currency levels are about to be shaken even further and the G6 nations, by the time they complete their high priced dinners and evening events, will walk out of the G7 meeting staring down a greater global debt/currency/economic beast of their own creation.

SE Asia is in the process or rewriting and resolving issues of the past 10+ years (see Malaysia / Singapore).


China is in the midst of a massive debt cycle that is about to play out over the next 18+ months (totaling about 1.8 Trillion Yuan).


The Brasil Bovespa Index has rotated into new BEARISH territory.


The Mexican iShares (EWW) ETF is about to break multi-year lows.


The Hang Seng Index is setting up a possible topping pattern that could break down given state and corporate debt concerns.


The iShares Turkey (EURONEXT) index has already broken to new multi-year lows.


The G6 better have some rabbits in their hats that they can magically transform into big bullish projects over the next 12 months or the economic functions that are at play in the world already are likely to steamroll over the top of any news that originates from the G7 meeting.

The U.S. markets are setup for a continued bullish rally with a bit of Summer capital shifts. Our recent research called the rotation out of the tech heavy NASDAQ and a renewed capital shift into the S&P and the DOW leaders. This rotation is likely to continue for many weeks or months as global investors realize the earnings capabilities and dividends values within the U.S. blue chips are of far greater long term value than the risks associated with technology and bio-tech firms. Because of this, we believe the S&P and DOW/Transports are setting up for a massive price rally to break recent all time market highs.

Here is a Daily chart of the YM futures contract showing the recent price breakout and rally. Our expectation is that 26,000 will be breached within 30 days or so and that a large capital shift will drive a continued advance through the end of 2018 – possibly further.


Here is a Daily $TRANS chart showing a similar bullish move. Although the Transportation Index has not broken to new highs yet, we believe this upside move is just beginning and we believe the continued improvements in the US economy will drive the Transportation index to near 11,450 or higher before the end of this year.


Our opinion continues to support the hypothesis that the US markets are the only game on the planet (at the moment) and that a great capital shift is underway in terms of investment in, purchases of and generally opportunistic investment opportunities for US equities and markets going forward. Until something changes where the US dollar strength, foreign economic weakness and foreign debt cycles are abated or resolved, we believe the great capital shift that we have been warning of will continue which will put continued pressures on certain foreign markets and expand debt burdens of at risk nations over time.

Smart traders will be able to identify these opportunities and capitalize on them. They will see this shift taking place and take advantage of the opportunities that arise for quick and easy profits. If you like our research and our understanding of the global markets, be sure to join our premium research and Trade Alert Wealth Building Newsletter. Our valued members stay with us because we have continually proven to be ahead of nearly every market move this year – in many cases many months ahead of the global markets. So, with all of this playing out over the next 6+ months, we suggest you consider joining The Technical Traders to learn how we can help to keep you out of trouble and ahead of the markets for greater success.


Stock & ETF Trading Signals

Sunday, June 3, 2018

These Three Key Elements Will Drive Stocks Higher Into Year End

Last week was a roller coaster ride for traders and investors. After a long holiday weekend, traders were greeted with concerns originating in Italy regarding political stability and the potential that any further issues could result in a collapse of the EU. Even though the risk of this happening was somewhat minor, the US markets tanked near 2% as fear seemed to override common sense. The rest of this week has been a wild ride of price rotation within a range. We’ve been reading all types of news and comments regarding all types of “what if” scenarios from analysts and researchers while scratching our heads at some of the comments.

As we stated in our earlier article regarding the Italy political crisis [read it here], the one important aspect to trading and investing is to not lose focus on the true perspective and true market fundamentals. Yes, if you are an intraday trader, these wild price swings can either be great profits or wild losses as you try to swing with these rotational moves. As a swing traders/investor, though, we care about the overall stability and direction of the markets. We are willing to ride out some rotation as long as our core analysis is sound and the technical and fundamental basis of our trades is still in place.

In our opinion, there are three things that are core elements of our analysis at the moment and these three things are likely driving the economic future of the US equity markets.

The US Dollar continues to strengthen as the US economy shows solid signs of a broad based economic increase. Oil/Energy prices have continued to decline recently, now down nearly 10% from the recent peak, and this decrease relates to supply and demand expectations throughout the end of this year (roughly 4 - 6 months into the future). The Transportation Index is pushing higher as stronger economic activity is expected throughout the rest of 2018 and into 2019.

These Three Key Elements Cross-Populate as Follows

1.  The strong US dollar is acting like a magnet for foreign capital investment as the strength of the US dollar in combination with the strength of the US economy/equities markets creates a triple-whammy for foreign capital investments. Not only are foreign investors trying to avoid capital devaluation (currency price devaluation) and debt risks in their own local markets, they are trying to find ways to achieve ROI and stability for their capital investments. With almost nowhere else to go, the US equities markets and debt markets are pretty much the only place on the planet for this triple-whammy opportunity.

2.  The strong US jobs numbers and robust economic activity, in combination with the past capital market stimulus and lowered interest rates, are creating a fuel heavy economic environment in the US not that President Trump’s deregulation and policies have injected the Oxygen needed to create the “economic combustion” that is driving this current growth. Energy prices are moderate and dropping as a result of the shift in technologies attributed to electric and hybrid transportation enterprises. All of this, jobs growth, earning growth, economic growth, moderately low interest rates and a true combusting economy, provides for much greater opportunities for an advancing US equities market.

3.  The US equities markets are rotating higher throughout the global weakness and debt concerns while the Transportation index pushes higher as a sign that US investors expect the US economy to continue to grow. Transportations lead the us equities markets by about 4 to 6 months (on average). Lower oil prices, strong jobs numbers, dynamic opportunities in the US economy and a stronger US dollar drive continued US and foreign investments into the US equities markets and debt markets.


As we have stated in earlier research posts regarding “capital migration”, capital (cash) is always seeking the best environments for stability, growth and opportunity in a continual effort to balance risk vs. reward. Capital is capable of moving across the planet relatively quickly in most cases and is always seeking the best opportunity for ROI and stability while trying to balance unknown risks and devaluation. Right now, the only games in town are the established economies, the US, Canadian and UK markets.

As you can see in the graph below US investments continue to grow as the best risk/reward for capital.


Our opinion is that until something dramatic changes this current global economic environment and risk unknown, capital will continue to rush into the US markets even if the US dollar continues to climb or oil continues to fall. The only thing that can change this equation is the one key factor in understanding risk vs. reward – when does the opportunity for reward outweigh the risk of complete failure by applying capital into any other foreign or non-established market environment? When investors believe the reward of moving capital out of the US equity markets in search of new opportunities or advantageous risk/reward setups in foreign markets exists, that is when we’ll see a change in investment dynamics resulting in more downside pricing pressure in the US markets – and we don’t believe that will happen within the immediate 4~6+ month span.

Pay attention to our most recent research as we have been dead-on in terms of calling these market swings. The NQ chart, below, shows how the tech heavy NASDAQ is leading the breakout while the YM and ES markets lag a bit. We believe all of these US majors are in the process of breaking to new all time price highs and as the foreign market turmoil slowly unfolds, we may see some moderate price rotation. Yet we believe the global economic dynamics that are currently in place create a very opportunistic, rich, green opportunity for continued capital infusion into the US equity markets and a continued moderate advance of the US Dollar.


Remember, there is now over $12 trillion in capital that has been created and introduced into the global markets over the past 10+ years. All of this capital is searching for projects and investments to develop suitable ROI and gains. Where do you think this capital is going to go for the most stable, most capable and most successful ROI available on the planet? Think about that for a minute – where else would you consider putting capital to invest for safe and consistent returns right now?

This weekend could prompt a massive upside price breakout early next week on continued positive economic news or lack of any foreign market concerns. The bias of the US equity market is, and has been, bullish – just as we have been telling our members. If you have been fooled by this recent price rotation or other research posts, please consider Technical Traders Ltd. services to learn how we can help you profit from these moves.

We know you value our research and hard work trying to keep you ahead of these market turns and swings. Please consider joining our other loyal members where you’ll receive exclusive updates, video content, trading signals and access to our proprietary price modeling systems and proprietary research reports. Our proprietary research is already showing us where this market should be trading well into July 2019. If you value our research, analysis and detailed reporting like this article, then please visit The Technical Traders to learn how you can join our other members and begin receiving our exclusive research and more.

See you in the markets!
Chris Vermeulen


Stock & ETF Trading Signals

Monday, December 18, 2017

Should You Consider Investing/Buying Gold or Bitcoin?

Our trading partner Chris Vermeulen of The Technical Traders just put together this great article comparing Bitcoin against traditional commodities for investing and storing wealth....

Recently, we have been asked by a number of clients about the precious metals and what our advice would be with regards to buying, selling or holding physical or trading positions in the metals.  There are really only a few short and simple answers to this question and they are revolve around the concept of providing a hedge against risk, capital preservation and opportunity for returns.  Let’s explore the details a bit further.
First, Gold, historically, has been and will continue to be the basis of physical wealth for the foreseeable future.  Currently, Gold and Silver are relatively low cost compared to other assets offering similar protection.   As of right now, Gold and Silver are nearing the lowest price ratio levels, historically, that have existed since 1990.  This means, the relationship of the price ratio for Gold and Silver are comparatively low in relationship to how Gold and Silver are priced in peak levels.  So, right now is the time to be acquiring Gold and Silver as a low price hedge against another global crisis event or market meltdown.
People are starting to park their money in digital currencies, like Bitcoin and Ethereum, rather than parking them in fiat currencies – I buy and hold my currencies in this crypto wallet CoinBase. This is primarily due to the Negative Interest Rate Policy as well as Zero Interest Rate Policy of the Central Banks, which explains the sharp rise in the price of Bitcoin, this year.
Taking a look at this chart of the DOW Index shown in relative Gold Ounce price levels, we can see that every peak in this ratio above 15 or so has resulted in a dramatic ratio level reversion (decline).  This reversion means that asset prices (the DOW price level) declined while the price of Gold rose or stayed relatively stable.  The current level is well above 17 and any peak in this level should start the next rally in precious metals while global equities contract.


Second, the fact that the Gold and Silver price ratio is historically very low (meaning they provide a very good hedging opportunity at historically very low price ratio levels) also means that cash can be traded for physical gold with very limited risk and provide an excellent hedge for inflation, global market crisis events and as long term investments.  Taking advantage of the current market conditions, one has to be aware that crisis events do exist and present a clear risk to future equity investments.

One could decide to risk further capital hedging with options or short positions as risk becomes more evident, but these are inherently more risky than a physical Gold or Silver investment.  Physical Gold or Silver, especially rare coins which include greater intrinsic value, can provide real capital, real gains, real hedging of risk and real return – whereas the short positions or options are only valuable if the trade is executed to profit.
The relationship of the US Dollar to Gold is key to understanding precious metals valuations.  As the US Dollar increases in value, this puts pressure on the price of Gold because most of the world operates in US Dollars and Gold is typically a hedge against risk and inflation.  Therefore, as the US Dollar increases in value, there is a perceived view that risks and inflation are less of a threat to the global economy.
As this chart, below, shows, the US Dollar is currently settling within a FLAG formation that could result in downside price action – below recent support.  When we consider the first chart, showing the price of Gold being historically very cheap and the ratio being above 17, we must assume that any downside price activity in Gold is a blessing right now because these levels have not been seen since 1999, 1965 or 1929.  In other words, this is potentially a once-in-a-lifetime opportunity for investors.

Lastly, Gold and Silver are very limited in supply on this planet and, unless society decides that Gold or Silver is absolutely worthless as a substance, will likely continue to increase in value.  News that China and Russia are acquiring hundreds of tons of gold each year in preparation for a gold based currency is another set of reasons that you should consider starting your own physical hoard of precious metals.

The most important thing for you to understand about owning physical Gold and Silver is that it is a protective investment that can be liquidated or resold at almost any time in the future.  It can be traded, held, secured and transported easily.  You can physically take possession of your Gold and Silver and be assured that through any banking crisis, global market crisis or major global event, you have enough physical precious metal to operate in a crisis mode and likely attain great wealth/gains in the process.
Think of physical Gold and Silver like an “emergency kit”.  You hope you never need it, but when you do need it, you had better be prepared and have set aside some physical holdings before the crisis event happened.  Out here in California, we keep “Earthquake Kits” with emergency supplies, water, lanterns, food and other essentials.  Well, guess what is included in my Earthquake Kit?  Yup – Gold and Silver in proper quantities that I could barter and trade for items that are essential.
This final chart is the Gold to Silver ratio and is used to identify when price disparity between the two most common precious metals is opportunistic for one metal over the other.  When the price of Gold is high compared to the price of Silver, this ratio will climb.  When the price of Silver increases, because of perceived market risks, this ratio will decline.  Currently, one can see that we are nearing a peak in this ratio chart – meaning that Silver is much cheaper, in relative terms, than gold.  Because of this, investors should consider Silver and Gold as viable wealth protection.
Should another market crisis event unfold, both Silver and Gold will likely rally.  This chart is telling us that Silver will likely rally by a larger percentage value than Gold to result in a decline in this ratio and resulting in closer “parity” between the valuations of these two precious metals.  Again, currently, this is very close to a once-in-a-lifetime opportunity for investors.

The point of my post is that I can think of no reasons why anyone would not want to attain some physical Gold and Silver at today’s prices to protect against known risks, provide a hedge against inflation and crisis events and to protect wealth from what we all know will happen in a crisis event – the banks will close or limit cash availability (think of Greece).  So, it is really up to you to determine if and how you want to prepare for what could happen in the future.  Will you have your “emergency kit” and be prepared or not?
Now is the time to consider building your “emergency kit” and to prepare for the next market crisis event.  Our research team is ready to assist you and to keep you updated with Daily and Weekly update for all the major markets.
Visit The Technical Traders Here to learn more about our services and newsletters today.
Stock & ETF Trading Signals

Thursday, November 30, 2017

Capital Repositioning Driving Volatility Higher

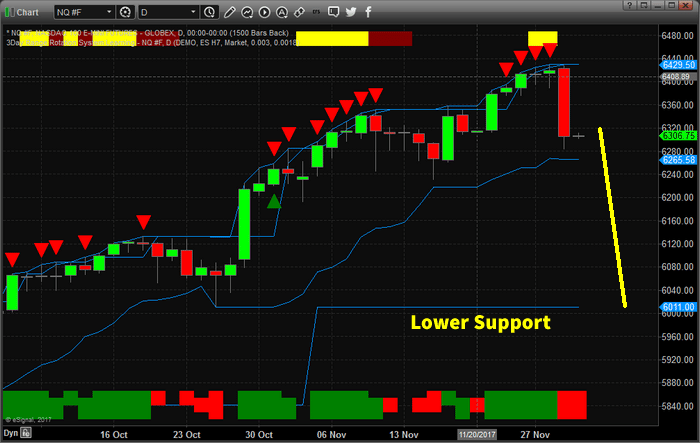
Recent moves in the FANG stocks shows that capital is starting to reposition within the global market.  As the end of the year approaches, expect more of this type of capital control to drive greater volatility within the markets.  At this time of year, especially after such a fantastic bullish run, it is not uncommon to see capital move out of high flying equities and into cash or other investments.
The recent move lower in the NQ has taken many by surprise, but the bullish run in the FANG stocks has been tremendous.  Facebook was higher +59% for 2017 (600% 2016 levels).  Amazon was up +61% for 2017 (550% 2016 levels).  Netflix was up +64.75% for 2017 (600% 2016 levels) and Google was higher by +37% for 2017 (1000% 2016 levels).  These are huge increases in capital valuation.
In early 2017, we authored an article about how capital works and always seeks out the best returns in any environment.  It was obvious from the moves this year that capital rushed into the US markets with the President Trump’s win and is now concerned that the end of the year may be cause to pull away from the current environment.
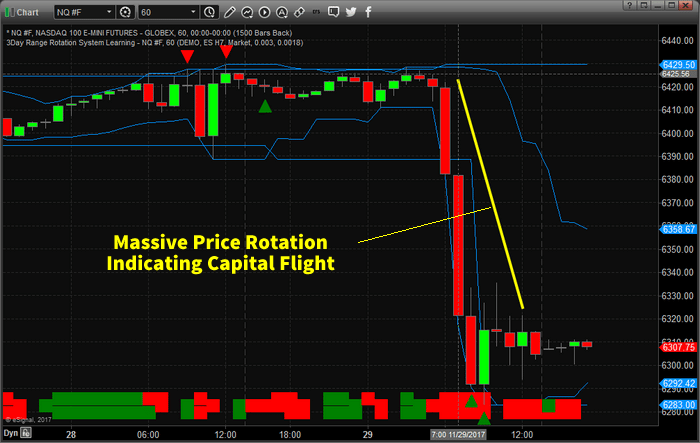
The current decline in the NQ, -2.25% so far, is not a huge decline in price yet.  Lower price support is found near the $6000 level.  Should this “Price Flight” continue in the NASDAQ, we could be looking at a 6~8% decline, or greater, going into the end of this year.
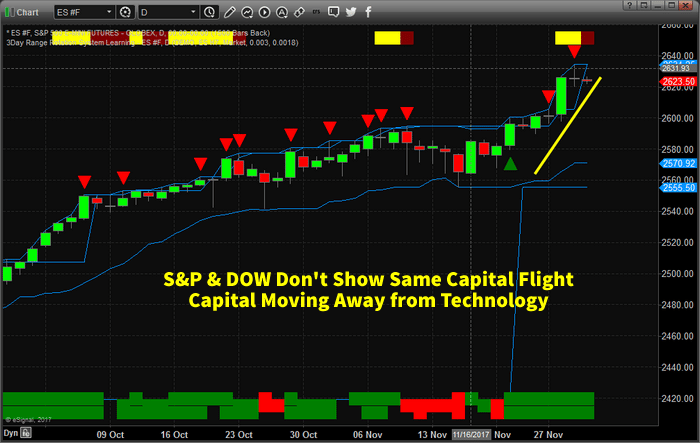
The price swing, this week, was very fast and aggressive.  In terms of capital, this was a massive price rotation away from Technology.  While the S&P and DOW Industrials continue higher, this presents a cause for concern with regards to the end of year expectations.
Will capital continue to rush into the US markets and specifically Technology stocks?  Or will capital rush out of these equities and into other sources of “safety” as technology melts down into the end of 2017?  Has the 40~60%+ price rally of 2017 been enough for investors to take their profits and run?
It is quite possible that capital will move to the sidelines through the end of this year and reenter the markets early next year as investors find a better footing for the markets.  The facts are, currently, that financials and transportation seem to be doing much better than the FANG stocks.  If this continues, we could be looking at a broader shift in the global markets – almost like a second technology bubble burst.
If you want to learn more about how we can assist you with your investment needs, visit The Technical Traders Here to learn more.  Our researchers are dedicated to assisting you and in helping you learn to profit from these moves.  2018 is certain to be a dynamic trading year – so don’t miss out.


Stock & ETF Trading Signals


Monday, August 28, 2017

VIX Spikes Showing Massive Volatility Increase

Today, we are going to revisit some of our earlier analysis regarding the VIX and our beloved VIX Spikes.  Over the past 3+ months, we’ve been predicting a number of VIX Spikes based on our research and cycle analysis.  Our original analysis of the VIX Spike patterns has been accurate 3 out of 4 instances (75%).  Our analysis has predicted these spikes within 2 to 4 days of the exact spike date.  The most recent VIX Spike shot up 57% from the VIX lows.  What should we expect in the future?

Well, this is where we should warn you that our analysis is subjective and may not be 100% accurate as we can’t accurately predict what will happen in the future. Our research team at Active Trading Partners.com attempt to find highly correlative trading signals that allow our members to develop trading strategies and allow us to deliver detailed and important analysis of the US and global markets.

The research team at ATP is concerned that massive volatility is creeping back into the global markets. The most recent VIX spike was nearly DOUBLE the size of the previous spike. Even though the US markets are clearly range bound and rotating, we expect them to stay within ranges that would allow for the VIX to gradually increase through a succession of VIX spike patterns in the future.

Let’s review some of our earlier analysis before we attempt to make a case for the future. Our original VIX Spike article indicated we believed a massive VIX spike would happen near June 29th. We warned of this pattern nearly 3 weeks ahead of the spike date. Below, you will see the chart of the VIX and spikes we shared with our members. This forecast was originally created on June 7th and predicted potential spikes on June 9th or 12th and June 29th.


What would you do if you knew these spikes were happening?

Currently, we need to keep in mind the next VIX Spike Dates
Sept 11th or 12th and finally Sept 28th or 29th.

Our continued research has shown that the US markets are setting up for a potential massive Head-n-Shoulders pattern (clearly indicated in this NQ Chart). The basis of this analysis is that the US markets are reacting to Political and Geo-Economic headwinds by stalling/retracing. The rally after the US Presidential election was “elation” regarding possibilities for increased global economic activities. And, as such, we have seen an increase in manufacturing and GDP output over the past 6+ months. Yet, the US and global markets may have jumped the gun a bit and rallied into “hype” setting up a potential corrective move.


Currently, the NQ would have to fall an additional 4.5% to reach the Neck Line of the Head-n-Shoulders formation. One interesting facet of the current NQ chart is that is setting up in a FLAG FORMATION that would indicate a massive breakout/breakdown is imminent. The cycle dates that correspond to this move are the September 11th or 12th move.


Please understand that we are attempting to keep you informed as to the potential for a massive volatility spike in the US and Global markets related to what we believe are eminent Political and Geo-Economic factors. Central Banks have just met in Jackson Hole, WY and have been discussing their next moves as well as the US Fed reducing their balance sheets. Overall, the US economy appears to show some strength, yet as we have shown, delinquencies have started to rise and this is not a positive sign for a mature economic cycle. Expectations are that the US Fed will attempt another one or two rate raises before the end of 2017. Our analysis shows that Janet Yellen should be moving at a snail’s pace at this critical juncture.


The last, most recent, VIX Spike was nearly DOUBLE the size of the previous Spike. This is an anomaly in the sense that the VIX has, with only a few exceptions, continued to contract as the global central banks continued to support the world’s economies. In other words, smooth sailing ahead as long as the global banks were supplying capital for the recovery.

Now that we are at a point where the central banks are attempting to remove capital from their balance sheets while raising rates and dealing with debt issues, the markets are looking at this with a fresh perspective and the VIX is showing us early warning signs that massive volatility may be reentering the global markets. Any future VIX Spike cycles that continue to increase in range would be a clear indication that FEAR is entering the markets again and that debt, contraction and decreased consumer participation are at play.

I don’t expect you to fully understand the chart and analysis below, but the take away is this. Pay attention to these dates: September 11, September 28 and October 16. These are the dates that will likely see increased price volatility associated with them and could prompt some very big moves.


This analysis brings us to an attempt at creating a conclusion for our readers. First, our current analysis of the Head-n-Shoulders pattern in the NQ is still valid. We do not have any indication of a change in trend or analysis at this moment. Thus, we are still operating under the presumption that this pattern will continue to form. Secondly, the current VIX spike aligns perfectly with our analysis that the markets are becoming more volatile as the VIX WEDGE tightens and as the potential for the Head-n-Shoulders pattern extends. Lastly, FEAR and CONCERN has begun to enter the market as we are seeing moves in the Metals and Equities that portend a general weakness by investors.

We will add the following that you won’t likely see from other researchers – the time to act is NOT NOW. Want to know why this is the case and why we believe our analysis will tell us exactly when to act to develop maximum profits from these moves?

Join the Active Trading Partners to learn why and to stay on top of these patterns as they unfold. We’ve been accurate with our VIX Spike predictions and we will soon see how our Head and Shoulders predictions play out. We’ve already alerted you to the new VIX Spike dates (these alone are extremely valuable). We are actively advising our ATP members regarding opportunities and trading signals that we believe will deliver superior profits. Isn’t it time you invested in your future and prepared for these moves?


Join the Active Trading Partners HERE today and Join a team dedicated to your success.


Stock & ETF Trading Signals

Thursday, June 22, 2017

How Gold Stocks Could Deliver Historic Gains in the Years Ahead

By Doug Casey

My regular readers know why I believe the gold price is poised to move from its current level of around $1,250 per ounce to $1,500… $2,000… and eventually past $3,000. Right now, we are exiting the eye of the giant financial hurricane that we entered in 2007, and we’re going into its trailing edge. It’s going to be much more severe, different, and longer lasting than what we saw in 2008 and 2009.

In a desperate attempt to stave off a day of financial reckoning during the 2008 financial crisis, global central banks began printing trillions of new currency units. The printing continues to this day. And it’s not just the Federal Reserve that’s doing it: it’s just the leader of the pack. The U.S., Japan, Europe, China… all major central banks are participating in the biggest increase in global monetary units in history.

These reckless policies have produced not just billions, but trillions in malinvestment that will inevitably be liquidated. This will lead us to an economic disaster that will in many ways dwarf the Great Depression of 1929–1946. Paper currencies will fall apart, as they have many times throughout history. This isn’t some vague prediction about the future. It’s happening right now. The Canadian dollar has lost 33% of its value since 2013. The Australian dollar has lost 27% of its value during the same time. The Japanese yen and the euro have crashed in value. And the U.S. dollar is currently just the healthiest horse on its way to the glue factory.

These moves show that we’re in the early stages of a currency crisis. But if you make the right moves, you could actually make windfall gains instead of suffering losses. Here’s how to do it. The huge winner during this crisis will be the only currency that has real value: gold.

Gold has been used as money for thousands of years because it has a unique combination of qualities. Very briefly, it’s durable, easily divisible, convenient to carry, consistent around the world, and has value in and of itself. Just as important, governments can’t create gold out of thin air. It’s the only financial asset that’s not simultaneously someone else’s liability.

When people wake up and realize that most banks and governments are bankrupt, they’ll flock to gold… just as they’ve done for centuries. Gold will rise multiples of its current value. I expect a 200% rise from current levels, at the minimum. There are many reasons, which we don’t have room to cover here, why gold could see a 400% or 500% gain.

This should produce a corresponding bull market in gold stocks… perhaps of a magnitude we’ve never seen. A true mania for gold stocks could develop over the coming years. This could make anyone who buys gold stocks at their current depressed levels very rich.

What History Teaches Us About Great Speculations

Many of the best speculations have a political element to them. Governments are constantly creating distortions in the market, causing misallocations of capital. Whenever possible, the speculator tries to find out what these distortions are, because their consequences are predictable.

They result in trends you can bet on. Because you can almost always count on the government to do the wrong thing, you can almost always safely bet against them. It’s as if the government were guaranteeing your success. The classic example, not just coincidentally, concerns gold.

The U.S. government suppressed its price for decades while creating huge numbers of dollars before it exploded upward in 1971. Speculators who understood some basic economics positioned themselves accordingly. Over the next nine years, gold climbed more than 2,000% and many gold stocks climbed by more than 5,000%.

Governments are constantly manipulating and distorting the monetary situation. Gold in particular, as the market’s alternative to government money, is always affected by that. So gold stocks are really a way to short government — or go long on government stupidity, as it were.

The bad news is that governments act chaotically, spastically.

The beast jerks to the tugs on its strings held by various puppeteers. But while it’s often hard to predict price movements in the short term, the long term is a near certainty. You can bet confidently on the end results of chronic government monetary stupidity. Mining stocks are extremely volatile for that very same reason. That’s good news, however, because volatility makes it possible, from time to time, to get not just doubles or triples but 10 baggers, 20 baggers, and even 100 to 1 shots.

When gold starts moving higher, it’s going to direct a lot of attention towards gold stocks. When people get gold fever, they are not just driven by greed, they’re usually driven by fear as well, so you get both of the most powerful market motivators working for you at once. It’s a rare class of securities that can benefit from fear and greed at once. Remember that the Fed‘s pumping-up of the money supply ignited a huge bubble in tech stocks in the late ‘90s, and then an even more massive global bubble in real estate that burst in 2008. But they’re still creating tons of dollars.

This will inevitably ignite other asset bubbles. Where? I can’t say for certain, but I say the odds are extremely high that as gold goes up, a lot of this funny money is going to pour into these gold stocks, which are not just a microcap area of the market but a nanocap area of the market. The combined market capitalization of the 10 biggest U.S. listed gold stocks is less than 6% of the size of Facebook. I’ve said it before, and I’ll say it again: When the public gets the bit in its teeth and wants to buy gold stocks, it’s going to be like trying to siphon the contents of the Hoover Dam through a garden hose.

Gold stocks, as a class, are going to be explosive. Now, you’ve got to remember that most of them are junk. Most will never, ever find an economical deposit. But it’s hopes and dreams that drive them, not reality, and even those without merit can still go up 10, 20, or 30 times your entry price. And companies that actually have the goods can go much higher than that.

You buy gold, the metal, because you’re prudent. It’s for safety, liquidity, insurance. The gold stocks, even though they explore for or mine gold, are at the polar opposite of the investment spectrum; you buy them for their extreme volatility, and the chance they offer for spectacular gains. It’s rather paradoxical, actually.

Why Gold Stocks Are an Ideal “Asymmetric Bet”

Because these stocks have the potential to go 10, 50, or even 100 times your entry price, they offer something called “asymmetry.” You probably learned about symmetry in grade school. It’s when the parts of something have equal form and size. For example, cut a square in half and the two parts are symmetrical.

Symmetry is attractive in some forms. The more symmetrical someone’s face is, the more physically attractive they are considered to be. Symmetry is often attractive in architecture. But when it comes to investing and speculating in the financial markets, the expert financial operator eschews symmetry. Symmetry is for suckers.

The expert financial operator hunts for extreme asymmetry.

An asymmetric bet is one where the potential upside of a position greatly exceeds its potential downside. If you risk $1 for the chance of making $20, you’re making an asymmetric bet. Amateur investors too often risk 100% of their money in the pursuit of a 10% return. These are horrible odds. But the financially and statistically illiterate take them. You might do better in a casino or most sports betting. It’s one of the key reasons most people struggle in the market.

I’ve always been more attracted to asymmetric bets… where I stand a good chance of making 10, 50, even 100 times the amount I’m risking. I’m not interested in even bets. I’m only taking the field if my potential upside is much, much greater than my potential downside. Because of the extreme asymmetry gold stocks offer—because of their extreme upside potential when they’re cheap—you don’t have to take a big position in them to make a huge impact on your net worth. A modest investment of $25,000 right now could turn into $500,000 in five years. It has happened before and it will happen again.

Right now gold stocks are near a historic low. I’m buying them aggressively. At this point, it’s possible that the shares of a quality exploration company or a quality development company (i.e., one that has found a deposit and is advancing it toward production) could still go down 10, 20, 30, or even 50 percent. But there’s an excellent chance that the same stock will go up by 10, 50, or even 100 times. I hate to use such hard to believe numbers, but that is the way this market works. When the coming resource bubble is ignited, the odds are excellent we’ll be laughing all the way to the bank in a few years.

No one, including me, knows that the Mania Phase is just around the corner. But I’ve operated in this market for over 40 years. This is a very reasonable time to be buying these stocks. And it’s absolutely a good time to start educating yourself about them. There’s an excellent chance a truly massive bubble is going to be ignited in this area. If so, the returns are going to be historic.

Regards,

Doug Casey
Founder, Casey Research


Note: Casey Research’s resident gold stock specialist, Louis James, has just unveiled a proprietary strategy for selecting small gold stocks. Over a 30 year historical backtest, the strategy had a 95% success rate. Remarkably, the strategy even produced winning plays during gold’s $700 drop from 2011 to 2015.

So, if the Mania Phase Doug predicts takes off, the asymmetrical gains you’ll see from these small gold stocks could hand you 10, 50, or even 100 times your money. Here, I explain the full story on Louis’ strategy so you can review it for yourself

This article was originally published at caseyresearch.com.


Stock & ETF Trading Signals