Showing posts with label IYT. Show all posts

Sunday, June 3, 2018

These Three Key Elements Will Drive Stocks Higher Into Year End

Last week was a roller coaster ride for traders and investors. After a long holiday weekend, traders were greeted with concerns originating in Italy regarding political stability and the potential that any further issues could result in a collapse of the EU. Even though the risk of this happening was somewhat minor, the US markets tanked near 2% as fear seemed to override common sense. The rest of this week has been a wild ride of price rotation within a range. We’ve been reading all types of news and comments regarding all types of “what if” scenarios from analysts and researchers while scratching our heads at some of the comments.

As we stated in our earlier article regarding the Italy political crisis [read it here], the one important aspect to trading and investing is to not lose focus on the true perspective and true market fundamentals. Yes, if you are an intraday trader, these wild price swings can either be great profits or wild losses as you try to swing with these rotational moves. As a swing traders/investor, though, we care about the overall stability and direction of the markets. We are willing to ride out some rotation as long as our core analysis is sound and the technical and fundamental basis of our trades is still in place.

In our opinion, there are three things that are core elements of our analysis at the moment and these three things are likely driving the economic future of the US equity markets.

The US Dollar continues to strengthen as the US economy shows solid signs of a broad based economic increase. Oil/Energy prices have continued to decline recently, now down nearly 10% from the recent peak, and this decrease relates to supply and demand expectations throughout the end of this year (roughly 4 - 6 months into the future). The Transportation Index is pushing higher as stronger economic activity is expected throughout the rest of 2018 and into 2019.

These Three Key Elements Cross-Populate as Follows

1.  The strong US dollar is acting like a magnet for foreign capital investment as the strength of the US dollar in combination with the strength of the US economy/equities markets creates a triple-whammy for foreign capital investments. Not only are foreign investors trying to avoid capital devaluation (currency price devaluation) and debt risks in their own local markets, they are trying to find ways to achieve ROI and stability for their capital investments. With almost nowhere else to go, the US equities markets and debt markets are pretty much the only place on the planet for this triple-whammy opportunity.

2.  The strong US jobs numbers and robust economic activity, in combination with the past capital market stimulus and lowered interest rates, are creating a fuel heavy economic environment in the US not that President Trump’s deregulation and policies have injected the Oxygen needed to create the “economic combustion” that is driving this current growth. Energy prices are moderate and dropping as a result of the shift in technologies attributed to electric and hybrid transportation enterprises. All of this, jobs growth, earning growth, economic growth, moderately low interest rates and a true combusting economy, provides for much greater opportunities for an advancing US equities market.

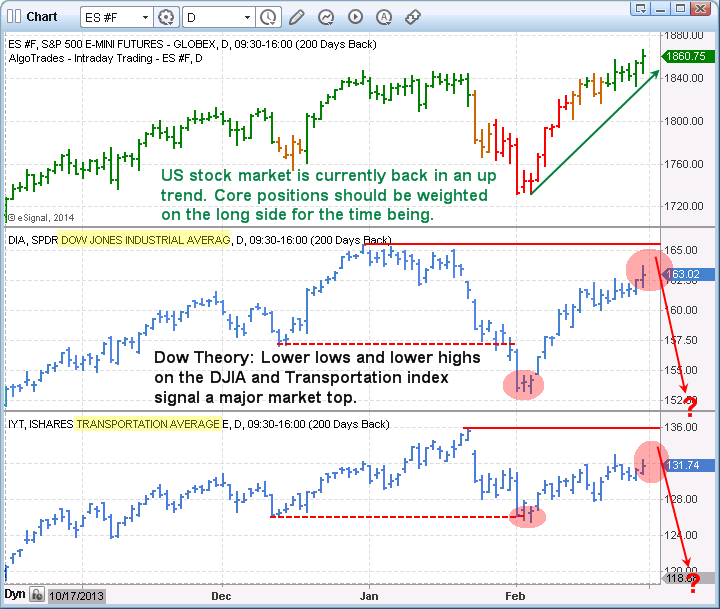
3.  The US equities markets are rotating higher throughout the global weakness and debt concerns while the Transportation index pushes higher as a sign that US investors expect the US economy to continue to grow. Transportations lead the us equities markets by about 4 to 6 months (on average). Lower oil prices, strong jobs numbers, dynamic opportunities in the US economy and a stronger US dollar drive continued US and foreign investments into the US equities markets and debt markets.


As we have stated in earlier research posts regarding “capital migration”, capital (cash) is always seeking the best environments for stability, growth and opportunity in a continual effort to balance risk vs. reward. Capital is capable of moving across the planet relatively quickly in most cases and is always seeking the best opportunity for ROI and stability while trying to balance unknown risks and devaluation. Right now, the only games in town are the established economies, the US, Canadian and UK markets.

As you can see in the graph below US investments continue to grow as the best risk/reward for capital.


Our opinion is that until something dramatic changes this current global economic environment and risk unknown, capital will continue to rush into the US markets even if the US dollar continues to climb or oil continues to fall. The only thing that can change this equation is the one key factor in understanding risk vs. reward – when does the opportunity for reward outweigh the risk of complete failure by applying capital into any other foreign or non-established market environment? When investors believe the reward of moving capital out of the US equity markets in search of new opportunities or advantageous risk/reward setups in foreign markets exists, that is when we’ll see a change in investment dynamics resulting in more downside pricing pressure in the US markets – and we don’t believe that will happen within the immediate 4~6+ month span.

Pay attention to our most recent research as we have been dead-on in terms of calling these market swings. The NQ chart, below, shows how the tech heavy NASDAQ is leading the breakout while the YM and ES markets lag a bit. We believe all of these US majors are in the process of breaking to new all time price highs and as the foreign market turmoil slowly unfolds, we may see some moderate price rotation. Yet we believe the global economic dynamics that are currently in place create a very opportunistic, rich, green opportunity for continued capital infusion into the US equity markets and a continued moderate advance of the US Dollar.


Remember, there is now over $12 trillion in capital that has been created and introduced into the global markets over the past 10+ years. All of this capital is searching for projects and investments to develop suitable ROI and gains. Where do you think this capital is going to go for the most stable, most capable and most successful ROI available on the planet? Think about that for a minute – where else would you consider putting capital to invest for safe and consistent returns right now?

This weekend could prompt a massive upside price breakout early next week on continued positive economic news or lack of any foreign market concerns. The bias of the US equity market is, and has been, bullish – just as we have been telling our members. If you have been fooled by this recent price rotation or other research posts, please consider Technical Traders Ltd. services to learn how we can help you profit from these moves.

We know you value our research and hard work trying to keep you ahead of these market turns and swings. Please consider joining our other loyal members where you’ll receive exclusive updates, video content, trading signals and access to our proprietary price modeling systems and proprietary research reports. Our proprietary research is already showing us where this market should be trading well into July 2019. If you value our research, analysis and detailed reporting like this article, then please visit The Technical Traders to learn how you can join our other members and begin receiving our exclusive research and more.

See you in the markets!
Chris Vermeulen


Stock & ETF Trading Signals

Sunday, May 13, 2018

How Congestion Basing Can Present Incredible Opportunities

Our research team here at the Technical Traders wanted to alert our followers to the incredible opportunities that continue to present themselves in the current market. While many people have been overly concerned about a market top and price rotation in the US majors, the Energy sector and many others have seen incredible price moves.

Take a look at this XLE chart as an example. Yes, we know that Oil has rallied from about $60 to closer to $70 recently, yet we want you to focus on the price pattern that setup this move in XLE. Specifically, we want you to focus on the Multi-Month Base pattern in price between early February and early April of 2018 as well as the upside breakout that followed.

In true technical analysis theory, price tells us everything and indicators assist us in relating current price movement/action to historical price movement/action. This simple chart illustrates how price setup a top/resistance zone near $78 in early January 2018, broke lower in early February, then setup a multi-month price support base for nearly 60+ days. This price support base because an extended bottom formation and a “price support zone” by testing and retesting the critical $65~66 price level while establishing a series downward sloping high price peaks. When it finally broke free of this support zone, near mid-April, price skyrocketed higher (+17% or more).


With the stock market showing all the signs that it is in the late stage of a bull market this is when traders need to start identifying the hot sectors or high probability continuation patterns. Why? because we have entered a stock pickers market. It’s simple really, it means all the stocks are not going to be rising together and if you put your money into the wrong sector you could lose money while the markets rise.

So where is the next hot sector? We believe a very similar pattern is setting up in the IYT (Transportation Index) just like we saw on the first chart of the XLE. We feel an upside breakout move is likely to happen within the next two weeks.

The setup of this price pattern is a bit broader and more volatile than the XLE Multi-Month Basing pattern – which means the IYT upside breakout could be more volatile and dramatic in form (possibly driving price +10% to 20% over an extended period).

Additionally, the high price peaks are setting up in a similar format with lower high price peaks over the span of the base. Support near $182.50 to $185 is critical and we believe the eventual upside breakout will be an incredible opportunity for traders.


This breakout will coincide with much of our other analysis of the US major markets which we have been sharing recently.

Our other recent trade alerts, that are up well over 10% each are UGAZ, FAS, and TECL. These have been rocketing higher – as we predicted. On Friday we closed our TECL position which hit our resistance level and we locked in the 18.3% gains with our members. The single point of success for all of us is to manage our assets well in an attempt to achieve greater long-term success.

If you have not seen or read much of our recent analysis, please visit The Technical Traders to learn more and review our work. Our exclusive members are already positioned for many moves like this in the markets and more continue to form each week.

We urge you to consider joining our Wealth Building Trading Newsletter as a member to receive our incredible insight, proprietary research, and trade alerts to assist your own trading success. We have delivered insights and research to our members that have clearly informed them of where we believe the markets are headed for many months in advance. Imagine how powerful that kind of research could be for you?

53 years experience in researching and trading makes analyzing the complex and ever-changing financial markets a natural process. We have a simple and highly effective way to provide our customers with the most convenient, accurate, and timely market forecasts available today. Our stock and ETF trading alerts are readily available through our exclusive membership service via email and SMS text. Our newsletter, Technical Trading Mastery book, and 3 Hour Trading Video Course are designed for both traders and investors. Also, some of our strategies have been fully automated for the ultimate trading experience.

Chris Vermeulen

Stock & ETF Trading Signals


Thursday, March 6, 2014

How Much Will a 15% Hair Cut Cost Your Investment Capital?

Over the past few weeks I have been watching the DOW and Transportation index closely because it looks and feels like the Dow Theory may play out this year and the stock market could take a 15% haircut.

But what if you skipped on the haircut and opted for a 40% refund?  What? Keep reading to find out how.

Keeping this post short and sweet, I think the U.S. stock market is setting up for a sharp selloff. And it will look a lot like the July 2011 correction. If my calculations are correct this will happen in the next 3-9 weeks and we will see a 15% drop from our current levels. Only time will tell, but I have a way to hedge against this with very little downside risk to you ETF portfolio.

The Dow Theory Live Example for ETF Portfolio

The daily chart of the SP500 index below shows our current trend analysis with green bars signaling an uptrend, orange being neutral, and red signaling bearish price action. Currently the bars are green and we can expect prices to have an upward bias.

The Dow Theory could be  in play. When both the Transports (IYT) and the Dow Jones Industrial Average (DIA) cannot make higher highs and start making lower lows, according to the Dow Theory the broad stock market is topping.

We are watching the market closely because they have both made lower highs and lows.  This rally could stall in the next couple weeks and if so we expect a 15% correction.


Model ETF Portfolio


Take a look at the 2011 Stock Market Crash

Model ETF Portfolio Trading

The chart above shows how fearful traders have a delayed reaction to moving money from stocks to a mix of risk-off assets.

The choppy market condition during August and September clearly helped in frustrating investors and created more uncertainty. This helped prices of this ETF portfolio fund rally long after the initial selloff took place. This is something I feel will take place again in the near future and subscribers of my ETF newsletter will benefit from this move.

Because we have a Dow Theory setup, our risk levels are clearly defined as to when to exit the trade if it does not play out in our favor. But with the potential to make 40% and the downside risk only being 4%, it’s the perfect setup for a large portion of our ETF portfolio. And just so you know this is not a precious metals trade as we are already long that sector and up 10% in that position already.

Get My Daily Video Forecasts & ETF Trades Today


Chris Vermeulen
The Gold & Oil Guy.com


Wednesday, December 11, 2013

Mish's Mid Week Market Minute $SPY $IWM $DIA $QQQ

Michelle "Mish" Schneider gives a quick run down of this market like no one else can. Here's her Free Market Minute for Wednesday....

Flat has several meanings. 1. Smooth and even, without marked lumps or indentations. I wonder how many can say that about their equity after Tuesday’s session? 2. Lacking interest or emotion; dull and lifeless. That’s a yes! 3. In or to a horizontal position. Describes the market internals or McClellan Oscillator.

The S&P 500 is flat. Flat as a word has several more urban definitions; but I will leave that to your own curiosity to look up online. Speaking of, Google (GOOG), far from flat, did make new highs.

Volume equally flat with an exception to the small caps, Russell 2000s, which posted a rather small distribution day. Remember, when you’re flat on your back, everything looks up!

S&P 500 (SPY) Held the fast moving average, which by the way, is flat.

Russell 2000 (IWM) Broke the fast moving average with 111 an important support level

Dow (DIA) Closed just shy of the fast moving average but also on support. Also have to mention that IWM SPY and DIA did not make new highs recently while QQQs did

Nasdaq (QQQ) Marginally worked off overbought conditions

XLF (Financials) Volcker rule announcement had an impact. Sitting on support

SMH (Semiconductors) Holding the runaway gap

XRT (Retail) With a 6 day correction, 85.60 is pretty much the risk should this start to turn up

IYT (Transportation) Marginally held 128.40

IBB (Biotechnology) Held 219 and still digesting

IYR (Real Estate) 63.20 is the place to hold now

XHB (Homebuilders) Floundering around above the 50 DMA

GLD Gapped up so that reversal candle was good after all-now, 122 great resistance

USO (US Oil Fund) Cleared the 200 DMA-and baby, it’s cold outside!

XLE (Energy) 2 inside days-good one to focus on for range break

TBT (Ultrashort Lehman 20+ Year Treasuries) TLTs doesn’t believe taper talk it seems

EWG (Germany) 30.33 is the low of the island top to clear to negate that pattern


Click here...To Get Michelle's Market Minute in your inbox every morning.


Get our "Gold and Crude Oil Trade Ideas"


Wednesday, July 3, 2013

Leading Sectors, Cycles and Momentum Point To Drop This Week

Chris Vermeulen's trade set up for the first week of July.....

As talked about almost two weeks ago when the SP500 trend reversed to the down side we have been waiting for a bounce in price to short the market (buy and inverse ETF). That happened last week and now we are waiting for the market to shake out the short positions and suck in as many traders to get long before the next wave of major selling takes place.

It seems traders are becoming bullish again as prices rise and they are dumping their precious metal positions and rotating into equities again from the looks of things. Also if you know the Dow Theory then you know the industrial and transportation sectors tend to lead the broad market. Well today the only two sectors trading lower are just those two.

See the charts for a visual


Wednesday, October 26, 2011

Evidence Supports the Bears’ Case for the S&P 500


I am not one to discuss fundamentals or macro views, but this situation in Europe is beginning to morph into a media frenzy. Price action in the marketplace is changing rapidly in short periods of time based on the latest press releases coming from the Eurozone summit.

I cannot help but comment on the seemingly arbitrary actions coming from this high profile meeting. Nothing has happened that market participants were not already privy too. The European Union is going to strengthen their EFSF fund by levering it up roughly 4 : 1. I have yet to hear how exactly they plan on doing this, but this action was no surprise to anyone that has read an article about the sovereign debt crisis in the past month.

There was also discussion about backstopping European banks’ capital position. Since European banks are holding billions (Euros) of risky sovereign debt instruments, it would make sense that their capitalization is a primary concern of Eurozone leaders based on current fiscal conditions. I would argue that the banks should be well capitalized regardless of economic or fiscal conditions in order for a nation to have a strong, vibrant economy that has the potential to grow organically.

The final piece of this week’s political nonsense involves write-downs on Greek debt in the neighborhood of 50% – 60% in order to stabilize Greece’s debt to GDP ratio. Apparently Eurozone leaders want to structure the write down so as to avoid payouts by credit default swaps which act as insurance against default. How does a bond take a 50% – 60% valuation mark down without a creating an event that would trigger the payout of CDS swaps?

If a write down of that magnitude does not trigger the CDS swaps, then I would argue they are useless as a tool to hedge against the default risk carried by sovereign debt instruments. If the CDS swaps do not payout as projected by European politicians, the risk assumed by those purchasing government debt obligations around the world would be altered immediately.

The impact this might have on the future pricing of risk for government debt instruments could be extremely detrimental to their ability to raise funds in the private market. Additionally, the write downs would hurt European banks’ capital positions immediately. If the CDS swaps were to pay out, bank capital ratios would suffer as those who took on counter party risk would be forced to cover their obligations thereby straining capital positions even further potentially.

Price action today suggested that the equity markets approved of the package that European leaders were working on. However, the biggest push higher came when news was released that China was interested in purchasing high quality debt instruments as a means to help prop up poorly capitalized banks and sovereign nations in the Eurozone through an IMF facility.

The market did an immediate about face which saw the Dollar selloff while the S&P 500 rallied higher into the close reversing a great deal of Tuesday’s losses. Inquiring minds wish to know where we go from here? I would be lying if I said I knew for sure which direction Mr. Market favored, however that did not stop me from looking for possible clues.

It has been a while since I checked out the short-term momentum charts that are focused on the number of stocks in U.S. domestic equity markets that are trading above their 20 & 50 period moving averages. The charts below illustrate the current market momentum:

Equities Trading Above the 20 Period Moving Average
Stock Above the 20 Day Average

It is rather obvious that when we look at the number of stocks trading above their 20 period moving average that momentum is running quite high presently. This chart would indicate that in the short-term time frames equities are currently overbought.

Equities Trading Above the 50 Period Moving Average
Stock Above the 50 Day Average

A similar conclusion can be drawn when we look at the number of stocks trading above their 50 period moving averages. It is rather obvious at this point in time that in the short to intermediate term time frames, stocks are currently at overbought levels. This is not to say that stocks will not continue to work higher, but a pullback is becoming more and more likely.

Additional evidence that would support the possibility that a pullback is likely would be the  recent bottom being carved out in the price action of the U.S. Dollar Index. The U.S. Dollar has been under selling pressure since the beginning of October, but has recently started to show signs that it could be stabilizing and setting up to rally higher.

The daily chart of the U.S. Dollar Index is shown below:
US Dollar Chart

The U.S. Dollar Index is sitting right at major support and is oversold based on historical price action. If the Dollar begins to push higher in coming days and weeks it is going to push equity prices considerably lower. Other risk assets such as gold, silver, and oil would also be negatively impacted by higher Dollar prices.

Members of my service know that I focus on several sectors to help give me a better idea about the broader equity markets. I regularly look at the financial sector (XLF), the Dow Jones Transportation Index (IYT), emerging markets (EEM), and the Russell 2000 Index (IWM) for clues about future price action in the S&P 500.

During my regular evening scan I noticed that all 4 sector/index ETF’s are trading at or near major overhead resistance. With the exception of the Dow Jones Transportation Index (IYT), the other 3 underlying assets have yet to breakout over their August 31st highs. The significance of August 31st is that is the date when the S&P 500 Index put in a major reversal right at the 1,230 price level before turning lower. It took nearly two months to regain the 1,230 level and its significance continues to hold sway.

The daily chart of IWM is shown below illustrating its failure to breakout over the August 31st highs:
IWM Russell 2000 ETF
The chart above illustrates clearly that IWM has failed to breakout above the August 31st highs. I am going to be watching IWM, XLF, & EEM closely in coming days to see if they are able to breakout similarly to the S&P 500. If they start to rollover, it will not be long before the S&P 500 likely follows suit.
Currently the underlying signals are arguing for lower prices in the short to intermediate term. While it is entirely possible that the S&P 500 rallies higher from here, it is without question that current market conditions are overbought in the short to intermediate terms.

Key sectors and indices are not showing follow through to the upside to help solidify the S&P 500′s recent break above the key 1,230 price level. Additionally, the U.S. Dollar Index is currently trading right at key support in addition to being oversold. At this time I am not playing the S&P 500 in either direction, but I will be watching the underlying price action in the U.S. Dollar Index closely. I will be watching for additional clues in the days ahead.

Market and headline risk is high presently.

Subscribers of OTS have pocketed more than 150% return in the past two months. If you’d like to stay ahead of the market using My Low Risk Option Strategies and Trades check out OTS at Options Trading Signals.com and take advantage of our free occasional trade ideas or a 66% coupon to sign up for daily market analysis, videos and Option Trades each week.

Chris Vermeulen & J.W. Jones

Friday, October 7, 2011

Is The SP 500 About to Stage a Multi Month Rally?


J.W. Jones of Options Trading Signals tells us where he sees this market headed...... 

The S&P 500 must have taken notice of the multitude of headlines coming at market participants and proceeded on a path of pure chaos. Since October 4th, the S&P 500 Index (SPX) managed to trade in a range that spanned from 1,074 to as high as 1,171 in 4 days. To put the past 4 days price action into perspective, the S&P 500 Index rallied 97 points or 9% in less than 96 hours.

Since late July, market participants have been dealing with a whipsaw that has been wrought with headline risk coming from Europe and huge swings in the price action of the volatility index. A few short days ago I was calling for a bounce higher in the SPX as every time frame was oversold. After the jobs number came out Friday morning domestic equities rallied sharply higher and in the short term prices were excessively overbought prompting some profit taking.

Around lunch time the news wires broke that Spain and Italy had their sovereign debt downgraded by Fitch Ratings. The downgrade put U.S. banks under pressure quickly and the price action started to rollover. By the end of the day price action was starting to work higher but a sharp selloff played out in the final 30 minutes of the session putting the major indices back into the red at the closing bell. So the real question that lies ahead is where do we go from here?

There is no easy answer to that question as the headline risk coming out of Europe over the weekend could have a dramatic impact on prices on Monday. Just as a reminder, U.S. bond markets will be closed on Monday for Columbus Day, but equities markets will be open as usual. At this point in time my short term bias is to the downside.

It would be healthy to see the S&P 500 roll over here and find a key support level where buyers step in and support prices. A higher low would be constructive and could lead to a more prolonged intermediate term rally which could last into the holiday season. However, before we can see any sort of rally we need to see a bottom form. While I do believe we have initiated that process, until I see a higher low carved out on the daily chart I will consider the current price structure to remain bearish.

In order to break to new lows, the SPX would have to push through several layers of support. I am of the opinion that we are unlikely to see the recent lows broken, but the chart below illustrates the key support levels going forward. A test of the 1,040 – 1,050 price range remains possible, but the price action the past week makes it seem less likely. Within the context of a hyper volatile period of time, just about any possible outcome remains feasible. The daily chart of the SPX below illustrates key support levels for the index:


In addition to the weak price action into the close on Friday, several other clues are pointing to potentially lower prices in the near future. Members of my service know that I focus daily on several underlying ETF’s which help me get a grasp of the overall market conditions. On Friday, the financials (XLF), the Dow Jones Transportation Index (IYT), and the Russell 2000 Index (IWM) all showed relative weakness against the S&P 500. The chart below illustrates the relative performance on Friday:


The financials and the Dow Jones Transportation Index are excellent sectors to monitor when trying to determine the future price action of the S&P 500. Most of the trading session on Friday the financials (XLF) were exhibiting relative weakness versus the S&P 500 Index. Later in the session, the Dow Jones Transportation Index (IYT) started to roll over as well and once both ETF’s were under pressure it was not long before the S&P 500 Index flipped the switch to the downside.

The financials (XLF), the Russell 2000 (IWM), and the Dow Jones Transports (IYT) all put in large reversal candlesticks on the daily chart by the close of business on Friday. This is an ominous signal that lower prices for domestic equities may be forthcoming. The fact that key sectors are showing signs of weakness is a negative omen for the S&P 500 and the early part of next week. However, there is a bright side to this scenario.

If support levels can hold up prices next week and we see a higher low on the daily chart form, the bottoming process could be underway which could lead to a strong rally into year end. Obviously a probe to new lows is possible, but I believe that we are in the beginning stages of forming a bottom and a base for a rally to take shape.

If support levels hold up prices, a bottoming formation will likely get carved out on the daily chart of the SPX. The chart below illustrates two potential outcomes that could cause prices to rally sharply. In one case, a higher low is formed and we see prices take off to the upside. The other scenario involves an intraday selloff down to the 1,040 – 1,050 price level that gets snapped back up and a huge reversal candlestick would be formed. These scenarios are common during bottoming processes. The daily chart of the S&P 500 Index is shown below with the two scenarios highlighted:


The other scenarios would involve prices blowing through support and possibly knifing down to test the S&P 500 1,000 – 1,008 support area. While I find this scenario to be less likely at this time, anything could happen in this trading environment.


The key in the short run is the utilization of defined risk through the use of stop orders. In addition, a trading plan with stop orders and profit taking levels planned ahead will help remove emotion in a volatile tape. The price action is wild, but from my perch the likely scenarios all involve some short term selling pressure. If my analysis is right, this could be a huge turning point for price action the rest of the year.
The next few weeks are going to provide us with clues about the rest of 2011. 

The question traders should really be asking is whether support will hold, or will we break below the recent lows? Right now, the upside looks limited, but in this trading environment the best thought out plans can turn out to be useless if price action does not cooperate. Be nimble and define your risk, as volatility is not likely to subside anytime soon.

Subscribers of OTS have pocketed more than 150% return in the past two months. If you’d like to stay ahead of the market using My Low Risk Option Strategies and Trades check out OTS at Options Trading Signals.com and take advantage of our free occasional trade ideas or a 66% coupon to sign up for daily market analysis, videos and Option Trades each week.


The Latest Options Trading Signals Articles
Stock & ETF Trading Signals