Showing posts with label VIX. Show all posts

Monday, July 7, 2014

Gold Option Trade – Will Gold Continue to Consolidate?

Until recently, the world has forgotten about gold and gold futures prices it would seem. A few years ago, all we heard about was gold and silver futures making new highs on the back of the Federal Reserve’s constant money printing schemes.

However, after a dramatic sell off the world of precious metals it became very quiet.


Gold prices have been in a giant basing or consolidation pattern for more than one year. As can clearly be seen below, gold futures prices have traded in a range between roughly 1,175 and 1,430 since June of 2013.


Chart1


The past few weeks we have heard more about gold prices as we have seen a five week rally since late May. I would also draw your attention to the fact that gold futures also made a slightly higher low which is typically a bullish signal.


At this point in time, it appears quite likely that a possible test of the upper end of the channel is possible in the next few weeks / months. If price can push above 1,430 on the spot gold futures price a breakout could transpire that could see $150 or more added to the spot gold price.


Clearly there are a variety of ways that a trader could consider higher prices in gold futures. However, a basic option strategy can pay handsome rewards that will profit from a continued consolidation. The trade strategy is profitable as long as price stays within a range for a specified period of time. Ultimately this type of trade strategy involves the use of options and capitalizes on the passage of time.


The strategy is called an Iron Condor Strategy, however in order to make this trade worth while we would consider widening out the strikes to increase our profitability while simultaneously increasing our overall risk per spread. Consider the chart of GLD below which has highlighted the price range that would be profitable to the August monthly option expiration on August 15th.


Chart2


As long as price stays in the range shown above, the GLD August Iron Condor Spread would be profitable. Clearly this strategy involves patience and the expectation that gold prices will continue to consolidate. This trade has the profit potential of $37 per spread, or a total potential return based on maximum possible risk of 13.62%. The probability based on today's implied volatility in GLD options for this spread to be profitable at expiration (August 15) is roughly 80%.


Our new option service specializes in identifying these types of consolidation setups and helps investors capitalize on consolidating chart patterns, volatility collapse, and profiting from the passage of time. And if you Advanced options trades are not your thing, we also provide Simple options where we buy either a call or put option based on the SP500 and VIX. The nice thing about buying calls and puts is that you can trade with an account as little as $2,500.


If You Want Daily Options Trades, Join the Technical Traders Options Alerts

See you in the markets!

Chris Vermeulen

Sign up for our next free trading webinar "Low VIX and What It Means to Your Trading"


Friday, July 4, 2014

Low VIX and What It Means to Your Trading....Our Next Free Webinar

You are invited to attend our next free webinar, presented by former CBOE floor trader Dan Passarelli on Tuesday July 15th at 4:30 EDT. Dan's focus for this webinar will be "Low VIX and What It Means to Your Trading".

Many traders are having a tough time making money in this market. Why? Low VIX. Professional traders use the VIX as a guide to gauge potential option profits. Attend this webinar with Dan and learn what the VIX is telling us about your trading this summer.

Don't miss this special webinar.

Just click here to reserve your seat now

See you Tuesday July 15th!

Ray @ The Crude Oil Trader

Our next free webinar "Low VIX and What It Means to Your Trading"....Just Click Here!


Wednesday, October 9, 2013

Who Knows More: The S&P 500 Options or Financial Pundits?

By now the major media outlets have made sure to inform the public that the U.S. government is shut down, or partially shut down depending on your political perspective. Most financial pundits are looking to the recent past for clues about what to expect in the future.

While the situation appears to be similar to what we witnessed in 2011 with the debt ceiling debacle, the outcomes may be significantly different. I am a contrarian trader by nature, and as such I am constantly expecting for markets to react in the opposite way from what the majority of investors expect.

A significant number of financial pundits and writers all have a similar perspective about what is likely to occur. It seems most of the financial punditry believe that until there is a resolution in the ongoing government debacle, market participants should expect volatility to persist. Some of the talking heads are even calling for a sharp selloff if no decision on the debt ceiling is made by early next week.

The debt ceiling decision needs to be made by midnight on October 17th otherwise the first ever default on U.S. government debt could occur. Thus far, the volatility index (VIX) has moved higher as investors and money managers use the leverage in VIX options to hedge their long exposure.

As can be seen here, we are seeing the VIX trade at the second highest levels so far in 2013.....Read the entire article "Who Knows More: The S&P 500 Options or Financial Pundits?"


How to Avoid a Devastating Retirement Planning Mistake


Thursday, August 4, 2011

Set The Emotion Aside, Here is a Technicians View of VIX, Gold, Silver, Crude Oil and the SP 500

So did Crude Oil Trader contributor J.W. Jones get whacked by the sell off.......

The following article is an update on the current technical position of the marketplace as I see it. Obviously the price action this week has been ugly as the situation in Europe has become front and center in the minds of traders and market prognosticators. The information below is an adaptation of what members of my service at Options Trading Signals.com received earlier today.

The S&P 500 sold off sharply earlier this morning and has since bounced higher. Price is drifting lower as I write this but on the shorter term time frame we may see a short / intermediate term bottom traced out during intraday trade today. It would make sense that prices would rebound after being so extremely oversold.

The 10 minute chart of the S&P 500 E-Mini futures chart below illustrates the intraday price action:

If the S&P 500 does carve out an intraday bottom, the daily chart of the S&P 500 below illustrates the key price levels that will come into play on a potential reflex rally:

The VIX is trading lower after popping higher this morning. The data coming out tomorrow and Friday may give traders an opportunity to get involved with a short side try on the VIX. However, I am going to wait patiently for the setup to present itself. Clearly any trade would be a shorter term type of trade as the VIX can behave wildly.

The usual suspects (IYT, XLF, EEM, IWM) are all trading to the downside again today. The financials (XLF) are showing relative weakness at this point in time. The rest of the usual suspects are all rolling over quite similarly to the S&P 500.

The daily chart of the XLF is shown below:

The U.S. Dollar Index futures are trading lower today and continue to base right at a key support level. If price breaks down we could see risk assets like the S&P 500 and oil push higher. For right now, the Dollar is trading well above key support.

Gold futures sold off sharply this morning but have since regained most of the intraday losses and are trading strongly to the upside from Tuesday’s close. Gold is starting to get a bit stretched to the upside and I am stalking a potential short trade on gold for the service. It would only be a short term trade, but I think a pullback is likely.

Silver futures have broken out and intraday price action has pushed silver above recent resistance levels. I’m not going to chase silver here as it could be the beginning of a failed breakout. However, if prices continue higher in coming days or price consolidates at this breakout level I will become interested in taking silver long.

For now, the precious metals are intriguing, but I like the price action in silver better than gold as we have more crisply defined risk levels as gold has runaway to all time highs.

The silver futures daily chart illustrates the key levels in silver:

Oil futures are trading sharply lower today and are coming into a key support level going back to late June. If those prices do not hold up, we could see oil trade down below the key $90/barrel price level. At this point in time, I am not interested in trading oil, but if price works down into the $85/barrel price level I will be interested in oil as a longer term trade for the service.

Lastly, Treasuries are really pushing higher recently. I am patiently stalking a long term entry on TBT for the service similar to the oil trade discussed above. For right now, I’m going to remain in cash and see how price action plays out. Members of my service have been sitting in cash for the past few weeks and we have sidestepped this entire selloff. While I’m sitting in cash for now, I have a growing list of names I am stalking for trades in the future.

Get J.W.'s calls directly to your inbox by signing up at Options Trading Signals.com 


Sunday, May 15, 2011

George S. Patton....Take calculated risks. That is Quite Different From Being Rash.....HI YO Silver, Away!

Last week silver was the focus of incredible price swings which left many licking their wounds and shaking their heads at the trading losses they had incurred. This sell off was likely triggered by the increase in margin requirements for futures contracts, but the stunning price decline extended to all vehicles like exchange traded funds use to trade the glimmering metal.

I recognized the potential opportunity early in the week, and began to look at various position structures using options on Tuesday morning. In order to understand the thinking behind this trade, it is necessary to understand the concept of implied volatility of an option contract. Implied volatility, together with time to expiration and price of the underlying security, form the three primal forces that rule the world of option pricing. This measure of volatility is best described as the collective opinion of traders as to the future volatility of the price of the underlying. Implied volatility is the variable which determines if options are priced cheap or overvalued.

One of the fundamental behavioral characteristics of options is the reaction of implied volatility to rapid price change. As a general rule, implied volatility goes down as the price of the underlying increases and vise-versa. Another functional characteristic is that it tends to revert to its historic mean once rapid price movements have moderated and actual price volatility returns to its historic range. The chart below is from a historical database of SLV implied volatility. Note the dramatic rise, indicated by the blue line, beginning in mid April and reaching historically unprecedented levels in early May.


Books have been written to describe details of various option trade structures, and a discussion of all potentially useful strategies is beyond the scope of my mission today. Suffice it to say that individual trades can be structured to respond either positively or negatively to reductions in implied volatility. Given the extremely elevated state of the SLV implied volatility, which side would you want to take? Hint: Volatility doesn’t remain elevated forever. A well-established characteristic of implied volatility is its tendency to revert to its historic mean.

The trade structure I chose to use was that of a calendar spread. This two legged spread is constructed by selling a short dated option and buying a longer dated option. The options selected to construct each spread are at the same strike price and are of the same class, either puts or calls. Maximum profit of each spread occurs at expiration of the shorter dated option when the price of the underlying is at the strike price of the spread. The main profit engine for this spread is the more rapid time decay of option premium in the shorter dated option relative to the longer dated option. My trade plan was to buy the May monthly option series which had 18 days of life remaining and sell the weekly options, an option series with only 4 days of life remaining when the trade sequence was started. An essential part of my plan was to adjust the spread as required by price movement to keep in the profit zone of the P&L curve.

It is important to recognize the “secret ingredient” of the spread that put the wind at my back; this special ingredient was the much greater implied volatility of the option I was selling compared to the option I was buying. In the language of the option trader, this situation is termed a positive “volatility skew”. This positive volatility skew increases our odd of success because we are selling a richly priced option and buying a more reasonably priced option; the old adage of “buy low, sell high” applies to volatility as well as price.

The trade that I will discuss began mid-morning on Tuesday, May 3 when SLV was trading around $42.50. My opening traded was to establish the calendar spread at the 42 strike, in options peak, this is known as an at-the-money calendar spread. The opening trade is displayed below:


Price continued to decline for the next several hours and by mid afternoon, SLV was trading around $40. This rapid decline was beginning to approach my lower breakeven price point at $39.24 and I felt I needed more room to allow for price action movement. At this point I chose to add an additional calendar spread at the 38 strike using puts to create a double calendar spread. The resulting trade lowered my breakeven point on the low side from the original $39.24 to $36.21. The new spread’s profitability curve is graphed below:


Price action the next day, Wednesday May 4, was a bit more subdued, and price remained within my profitable zone. Time decay of the short option premium was accelerating and no further action was required. All systems were “go”. The following day, Thursday May 5, price movement resumed its rapid decline and price had moved beyond the profitable zone of our double calendar spread. Action was required; “wishing and hoping” in these situations is strictly not allowed

The original position needed to be modified in order to re-establish a new zone of profitability surrounding the current price of SLV. Because SLV had moved well below the lower breakeven point of the double calendar, radical surgery was necessary. I chose to remove the entire position and re-center the spread. I closed both the 42 call calendar and the 38 put calendar and bought 2 put calendars at the 34 and 35 strikes. As Thursday ended, I had the position illustrated below:


Price movement during the next day, Friday, remained within the range of $33.60 to $35.57. These price extremes for the day were within our limits of profitability of the new double calendar. I closed the spread by mid afternoon when the time premium of the options I had sold short had largely eroded.

This trade had a profit of 15.9% net of commissions for trade duration of approximately 72 hours. I think the lesson to be learned from this trade is that a knowledgeable option trader can survive and prosper in a variety of market conditions. This demonstration is, I think, an example of the tremendous power of options to mitigate risk and provide controlled risk trading opportunities in fast moving markets.
This trade has been part of a strong period of performance for members at OptionsTradingSignals.com

Recent performance has been outstanding as 6 out of 7 trades have produced profits while the final trade remains open. The following returns are based on trade entry and executions. Commissions have not been factored in as option commission structures are different and members may have received a better or worse trade execution. With that said, the gross returns are listed below:

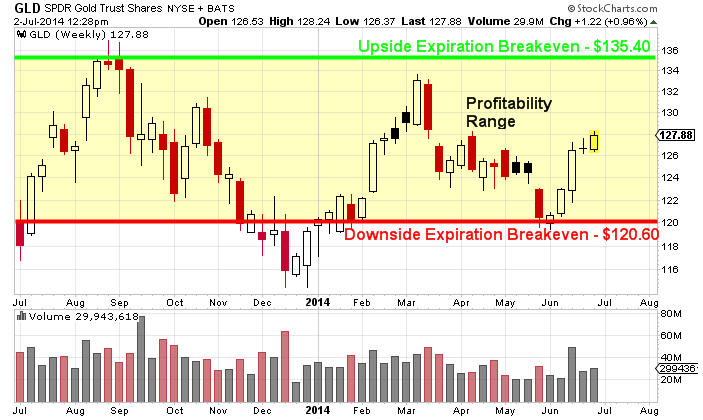
GLD Call Calendar Converted To Vertical Spread – 58%
RUT Call Calendar Spread – 12%
SPY Call Vertical Spread – 32%
SLV Call Calendar Spread Converted to Double Calendar Spread – 18%
AMZN Call Calendar Spread – 37%
SLV Call Calendar Spread Discussed Above – 20%


The cumulative return of the most recent 6 trades is 177%. Obviously the recent track record has been strong and the overall return for members would differ based on position size, risk tolerance, and account size. Since the beginning of the service in December, the overall win / loss record is 14 winning trades, 1 breakeven trade, and 8 losing trades. The overall successful trade percentage based on the trades that have been closed is just shy of 61%. In full disclosure, two trades remain open at this time.

Recently I have used a lot of calendar spreads due to the low volatility environment we have been trading in. The trade constructions that I use adjust based on volatility levels of underlying assets and the VIX index in general. Essentially the service does not use the same trades over and over unless the volatility environment is little changed. Recently we have had consistently low volatility levels and calendar spreads have been attractive. In the future, volatility levels will likely change and other trade constructions would be warranted at that time.

The special offer currently being presented to new members is an extreme value. Most long term members have pointed out that they would be willing to subscribe just for the daily technical analysis provided as well as the 2 – 3 weekly videos that members receive that contain technical analysis of key indices, futures, and ETF’s. My primary focus is to deliver value to members beyond just solid trade management and performance.

I am focused on performance, but my greatest thrill is watching novice option traders start to learn how to trade options in spreads effectively and for consistent profits. Options are one of the most overlooked trading tools in financial markets and the power they offer individual investors is consistently overlooked. Options are more than just hedging tools; they offer individual investors the power to diversify away from standard assets.

Join J.W. Jones at Options Trading Signals.Com and learn to harness the power that options offer investors and traders alike!


Share
Stock & ETF Trading Signals