Showing posts with label uptrend. Show all posts

Tuesday, June 17, 2014

Solar Energy Sector ETF Breaking Out – How to Trade It

During the past couple months several indexes, sectors and commodities have sold off more than 10 – 20%. But now some are looking like new buying opportunities. Over the next week I will bring a few of these trades to your attention as they start to unfold.

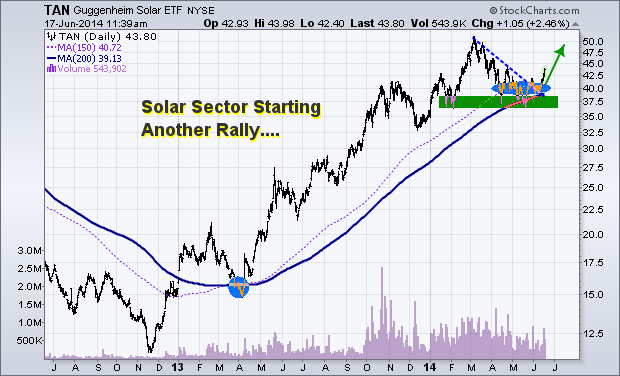
Today we are looking at the TAN solar ETF. This sector recently had a 23% hair cut in price. A 20-25% correction in price is a typical intermediate correction for a fast moving sector. The price correction has pulled the sector down to its 150 and 200 simple day moving averages. These levels tend to act as long term support for investors, a buying point.

Many of the individual stocks within this sector are starting to pop and breakout of bullish price patterns. These individual stock prices point to higher prices for TAN going forward. Be aware of crude oil…. I do think that as long as the price of crude oil stays up solar stocks will continue to rise overall. But if oil starts to roll over and break down, TAN will struggle.

My Technical Take on The Chart:
 
Big picture analysis shows a powerful uptrend with bullish consolidation.

Intermediate analysis shows a falling bullish wedge, test of moving averages, and a reversal breakout pattern.

tan

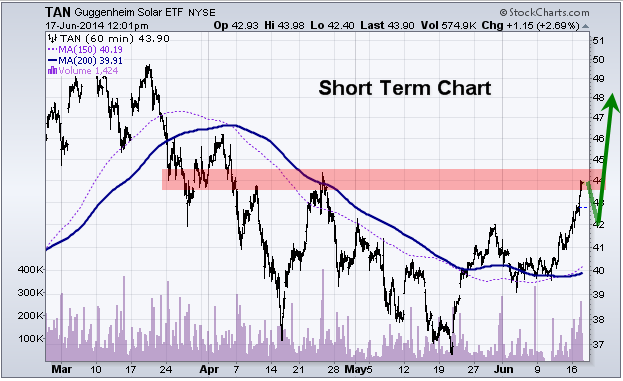
Short term analysis shows we are at a resistance level and we will likely see a pause of pullback over the next few days before it goes higher.

TANshortterm

TAN Trading Conclusion:
 
If price closed back below the $39.00 I would consider this bounce/rally failed.

Get My Trade Ideas Delivered To Your Inbox FREE: Gold & Oil Guy.com


See you in the markets,
Chris Vermeulen
Founder of  Technical Traders Ltd. - Partnership Program


Get our "Beginner's Guide to Trading Options....Just Click Here!


Saturday, May 4, 2013

Stocks Preparing for Pullback, Buy Bad News, Sell the Good

The SP500 remains in a strong uptrend, but the index has posted a sizable gains for 2013 thus far so it’s only logical that a pullback within this bull market takes place sooner than later.

With May now upon us and historically prices fall more times than not we feel a 3-4 weeks correction is on the verge of starting. This Friday we just had very strong economic numbers confirming the economy is recovering. This news has sent stocks sharply higher as shorts cover their positions and investors who are not yet long get into position to profit from higher prices. But the herd psychology and their trades are typically incorrect as they invest based on fear and greed. The old saying is buy on negative news and sell on positive news will typically get you on the correct side of the market more times than not if used with price, volume and cycles.

The Technical Traders – SP500 Index Weekly Chart

If we look at the price of the SP500 we need it to breakdown below the recent pivot low before we become bearish. Volume which is not shown on this chart is below average as price moves higher and this is a bearish sign also.

Looking at a basic cycle using the stochastics indicator we can see that the current cycle is starting to turn down. Cycles tend to lead price during an uptrend so we could still have stocks move higher for another week or so but be aware that when price starts to drop its likely a market top. But until then you must respect the uptrend. Stocks can remain overbought and toppy looking for months… so done be gambling and trying to pick a top until we see breakdown start.

spy2

SP500 Stocks Trading Above 200 Moving Average – The Technical Traders View

Stocks trading above the 200 day moving average is a great indicator for helping spot broad market underlying strength/weakness. It does lag the market but is still very powerful. The chart below shows this info and my thinking of what is likely to unfold sooner than later though price may still rise for several days yet.

We also use a similar chart for timing swing trades and market tops which are based on stocks trading above the 20 day moving average. This chart is not shown here but is now trading at a level which generally triggers selling/market top.

spy1

Stock Market and SP500 Trading and Investing Conclusion:

In short, we are still bullish on the market as we focus on trading with the trend. We do not pick market tops and we do not pick market bottoms. Knowing that stocks make their biggest moves at the end of their uptrend and at the end of a down trend it’s only common sense that risk is extremely high if you are betting against the current trend.

The best thing to do is wait for a technical breakdown and reversal which puts the odds more in your favor with much less risk and typically a clear line in the sand to exit the position if you are incorrect.

The last major stock market top which formed in September of last year had a series of strong news and strong price action persuading the herd to buy stocks. Instead it was the last impulse wave up just before a strong correction took place. That is much like what we see now with the economic news.

Join our free newsletter and stay on right side of the market while reducing your trading/investing stress. My simple yet effective analysis walks you through the market each week without bias. Remember Price and Volume is what makes you money trading NOT news or forecasts.

Join our FREE Newsletter Today!


Check out our current specials for full subscription members.

Wednesday, May 1, 2013

Does this concern you? Let's look at the "Macro Trend of the Markets"

Great post from our trading partner Doc Severson this morning.....

The Bureau of Labor Statistics stated 60% more seniors are working today than they were 10 years ago. Isn't that shocking? There are some clear reasons for this.

When I was a kid, I was told to "save for retirement" and invest in the stock market. This was good advice when bank interest rates were upwards of 10%, and you could count on the S&P making regular advancements. But over the last 13 years, people are only now starting to see the writing on the wall.

Back in the day, the macro trend of the markets steadily climbed from the mid-70s UNTIL the peak in 2000.

imageForBLS.png


But since the crash in 2000, we've seen nothing but sideways trading for the last 13 years and interest rates at an all time low. During the same time, we also had two major crashes, and well.....who knows what could happen by the end of the year.

So what's next?

I'd rather not pretend to predict the market. Instead, I'll continue to trade a robust trading plan, proven to generate a consistent monthly income during the same time most people have struggled.

It's a system that's taken me years to develop, and is uniquely designed to use a combination of non-directional strategies, semi directional strategies, and directional strategies. This way your trading results are independent of market direction!

Not only will I teach you how to trade these trading strategies, when you enroll in OptionsMD today, I'll take you by the hand to show you exactly what I plan to trade, how I plan to trade it, and let you see my open trades.

So what do you say?

Bottom line....If you want to learn how to make a consistent monthly income by protecting and growing your wealth Click here to join me inside of OptionsMD today!


Tuesday, January 31, 2012

Crude Oil Bulls Can't Seem to Take Advantage of Price Action Above $100

Crude oil closed down $0.42 a barrel at $98.35 today. Prices closed nearer the session low today and scored a bearish “outside day” down on the daily bar chart. Prices were pressured by a firmer U.S. dollar index today. Crude oil bulls have the overall near term technical advantage. However, the going does get tough for the bulls once prices move above the key $100.00 level.

Gold futures closed up $4.00 an ounce at $1,783.30 today. Prices closed near mid range today, hit a fresh seven week high and closed at a bullish monthly high close. Gold bulls still have the solid overall near term technical advantage and still have upside near term technical momentum. A steep four week old uptrend is in place on the daily bar chart.

Natural gas closed down 20.9 cents at $2.504 today. Prices closed nearer the session low today. Bulls faded today. Bears have the overall near term technical advantage. The next upside price breakout objective for the bulls is closing prices above major psychological resistance at $3.00.

Market Trends Trading Made Easy.....Learn How!

Wednesday, September 7, 2011

Storms Put Pressure on Crude Oil Shorts, Bulls maintain The Advantage

Crude oil is trading higher as the effects of tropical storm Lee and threats of a new storm work through the gulf region. But traders see this as temporary short covering rebound as lack of confidence in the Europe financial crisis dominates commodity futures. Crude oil Stochastics and RSI are overbought and are turning bearish signaling that the corrective rally off August's low might be ending soon.

Closes below August's uptrend line crossing near 84.26 would confirm that the aforementioned correction has ended. If October renews the decline off May's high, the 75% retracement level of the 2009-2011 rally crossing at 71.73 is the next downside target. Closes above the reaction high crossing at 89.19 are needed to confirm that a short term low has been posted.

First resistance is last Thursday's high crossing at 89.90. Second resistance is the May-July downtrend line crossing near 93.51. First support is August's uptrend line crossing near 84.26. Second support is the reaction low crossing at 82.95. Crude oil pivot point for Wednesday morning is 85.27.

Monday, August 22, 2011

David Banister: Is Gold on the Verge of Major Correction?


Just under two weeks ago I wrote about gold likely running to a final top with various levels ranging from 1862 to 1907 per ounce as likely. So far, we bottomed with a pivot at $1730 which I mentioned to my paying subscribers and we have run to as high as $1898 per ounce counting futures trading on August 22nd. What should we expect now as the most likely intermediate trading pattern for Gold?

Clearly, Gold is overbought on traditional technical measures such as RSI, MACD, and Moving Averages and more, so that is one warning flag. To wit, Gold historically pulls back pretty aggressively anytime it has run much above its 20 week EMA line. On a daily chart that stands at about $1730 per ounce, and on a weekly chart around $1580 per ounce. This week marks Fibonacci week #8 from the 1480 pivot lows of a wave 4 pattern I outlined for my subscribers as likely to turn gold higher to 1730 plus. In addition, we are 34 Fibonacci months into this 5 wave Bull Run from the October 2008 $681 lows.

I use Elliott Wave Theory combined with sentiment indicators and other measures to help determine major buy and sell pivots for Gold, and this methodology has been extremely accurate and successful for years. Right now I can count Gold as coming into a final 5th wave thrust to all time highs with sentiment running at huge extremes and technical patterns screamingly overbought. This action in Gold over the last many weeks reminds me of the final blow off top of the NASDAQ in 2000 as it ran from 4000 to 5000 in a few months and exhausted the buyers. This 5 wave pattern began 34 months ago and the final 5th wave usually drags as many taxi cab drivers onto the back of the Bull just in time to dump them off with a bag in their hand and no ride.

The bottom line is Gold is in a 13 year upwards cycle, and we are in about year 10 and it’s due for a likely pause in the uptrend, and certainly a correction of 10-15% would be normal in any massive bull cycle to kick all the bulls and latecomers off the back of the charging Bull. This pause should be a Primary wave 4 consolidation, where 2 and 4 are corrective and 1, 3, and 5 are bullish cycles.

Below is the latest chart on gold, not counting the overnight $1898 highs last night, but you can see that Gold is above the normal pivot high lines where we have seen major corrections over the past 34 month up cycle. A major parabolic blow off rise is of course possible, but hedging long positions and or considering shorting gold for the more aggressive players is advised:


Consider joining us at TMTF for forecasts and tradable pivot ideas on the SP500, Gold, and Silver with stunning accuracy. Check us out at Market Trend Forecast.com for a 33% discount coupon or to sign up for occasional updates.

Thursday, October 28, 2010

Crude Oil Technical Outlook For Thursday Morning Oct. 28th

Crude oil was higher due to short covering overnight as it consolidates some of Wednesday's decline. Stochastics and the RSI are turning bullish signaling that sideways to higher prices are possible near term.

Closes above the reaction high crossing at 84.80 are needed to confirm that a short term low has been posted. If December renews last week's decline, trendline support drawn off the August-September lows crossing near 78.57 is the next downside target.

First resistance is Monday's high crossing at 83.28
Second resistance is the reaction high crossing at 84.80

Crude oil pivot point for Thursday morning 81.72

First support is last Wednesday's low crossing at 79.90
Second support is the uptrend line drawn off the August-September lows crossing near 78.57


What do all market wizards have in common?

Share

Wednesday, October 20, 2010

Crude Oil Signals Sideways to Lower Prices Possible

Crude oil was higher due to short covering overnight as it consolidates some of Tuesday's decline but remains below the 20 day moving average crossing at 81.33. Stochastics and the RSI are bearish signaling that sideways to lower prices are possible near term.

If December extends Tuesday's decline, trendline support drawn off the August-September lows crossing near 77.75 is the next upside target. Closes above the 10 day moving average crossing at 82.52 would confirm that a short term low has been posted.

First resistance is the 20 day moving average crossing at 81.33
Second resistance is the 10 day moving average crossing at 82.52

Crude oil pivot point for Wednesday morning is 81.30

First support is the overnight low crossing at 79.90
Second support is the uptrend line drawn off the August-September lows crossing near 77.75

Watch: The Ultimate Price Target For Gold!

Share

Wednesday, October 13, 2010

Mid-Week Market Report on Equities and Metals

It's been an interesting week with stocks, commodities and currencies having a knee jerk reaction to the FOMC minutes released Tuesday afternoon. In short the Fed clearly said there must be more quantitative easing before things will get better. It was this news which triggered a rally in both stocks and commodities. Quantitative easing is a fast way to devalue the dollar and the Fed is doing a great job at that. As long as the dollar continues to decline the stock market will keep rising.

This week kicked off earning season with INTC and JPM beating analyst estimates. We usually see the market trade up the first week of earnings and then start to sell off by the end of earnings season. Both INTC and JPM sold off on strong volume today despite the good earnings and today’s broad market rally. This just goes to show the market has not forgot about buy on rumor sell on news… The big/smart money sold into the morning gaps exiting at a premium price. Is this foreshadowing for what is to come?

Take a look at the chart below which shows the falling dollar and how its helping to boost stocks and commodities.


While earnings season is trying to steal the spot light in the market, the fact is everything for the past 2 months has been about the US Dollar. If you put a chart of the dollar and the SP500 together they trade almost tick for tick in reverse directions. The amount of money getting pumped into the market cannot last and it will lead to a huge volume reversal day in due time. Until this happens the market will trade higher.

Taking a look at the SPY daily chart the 5, 10, and 14 simple moving averages tend to act as buy zones. The market was choppy from April until about 2 months ago. Now we are seeing the market smooth out and traders are switching to more of a trend trading strategy and not so much looking for extreme sentiment levels which typically signal short term tops and bottoms. Focusing on buying at these moving averages has been providing good support thus far. Stops should be set on a closing basis, meaning if the market is to close below the moving average then exiting the position is a safe play. It’s always best to layer your stops (scale out) in trending market. So stops below the 5, 10, 14 and even the 20ma will provide you with enough wiggle room to riding a trend.


Mid-Week Trading Conclusion:
In short, we are in a strong uptrend and until we get a major reversal day, buying the market is the way to go. The market as we all know is way over bought so if you decide to take a position on your own, be sure to keep it small. I would also like to note that financial stocks were the worst performing on the day so that could be telling us there could be some profit taking in the next day or two.

Chris Vermeulen
The Gold And Oil Guy.com

Get More Free Reports and Trade Ideas Here for Free: FREE SIGN-UP


Share

Saturday, January 3, 2009

How Do We Connect The Stock Market Dots In 2009


One of the easiest ways for a trader to determine the trend of the stock market in the new year is to simply connect the dots. In this new five minute video, I explain how you can connect the dots in any market to determine its trend. I will show you three examples of connecting the dots.

1. How to determine a downtrend.
2. How to determine an uptrend.
3. How to determine when a market is making a change of direction.

One of the key components we look for is how a market closes on a Friday or the last trading day of the week. This is when traders have to decide what they want to do with their positions. It also tells you with a high degree of probability which way the market is headed for the upcoming week. This trading secret is brought to us by Adam Hewison who learned this from years of trading on the floor of the exchange in Chicago and it is one we would like to share with you today. I feel that this technique has a lot of validity, particularly in light of today's volatile markets.

Just Click Here To Enjoy The Free Video
Stock & ETF Trading Signals