Apache CEO, Steve Farris, discusses the acquisition of Cordillera Energy Partners for $2.85B, saying its a unique bolt on opportunity that more than doubles Apache's acreage in a highly liquids-rich fairway in the Anadarko Basin.
Get your free trend analysis for Apache
TraderSmarts Premium Live Intraday Trade Alerts
Tuesday, January 24, 2012
Monday, January 23, 2012
European Union Ban on Iranian Imports Give Crude Oil Bulls a Boost

Iran has threatened to close the Strait of Hormuz, the transit point for about a fifth of global oil, if its exports are banned. The high range close sets the stage for a steady to higher opening on Tuesday. Stochastics and the RSI are neutral to bearish signaling that sideways to lower prices are possible near term.
If March extends this month's decline, December's low crossing at 92.95 is the next downside target. Closes above the reaction high crossing at 102.24 would confirm that a short term low has been posted. First resistance is the reaction high crossing at 102.24. Second resistance is this month's high crossing at 103.90. First support is today's low crossing at 97.40. Second support is December's low crossing at 92.95.
Check out our gold trend forecast for the 1st Quarter of 2012
EIA: Arctic Crude Oil and Natural Gas Resources
Resource basins in the Arctic Circle region (click to enlarge)
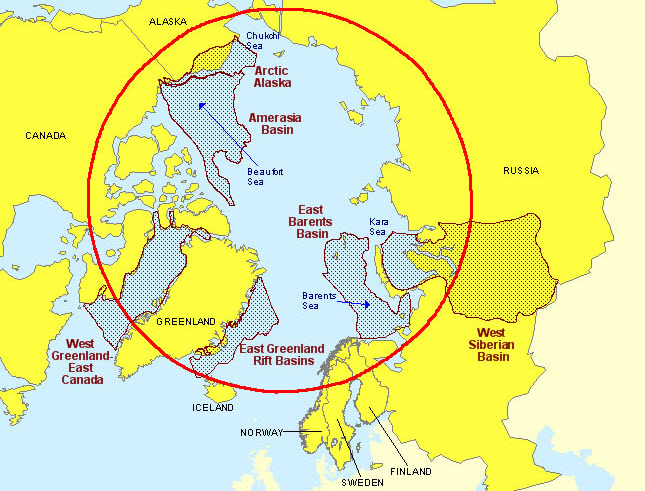
Source: U.S. Geological Survey.
The Arctic holds an estimated 13% (90 billion barrels) of the world's undiscovered conventional oil resources and 30% of its undiscovered conventional natural gas resources, according to an assessment conducted by the U.S. Geological Survey (USGS). Consideration of these resources as commercially viable is relatively recent despite the size of the Arctic's resources due to the difficulty and cost in developing Arctic oil and natural gas deposits.
Studies on the economics of onshore oil and natural gas projects in Arctic Alaska estimate costs to develop reserves in the region can be 50-100% more than similar projects undertaken in Texas.
Profitable development of Arctic oil and natural gas deposits could be challenging due to the following factors:
- Equipment needs to be specially designed to withstand the frigid temperatures.
- On Arctic lands, poor soil conditions can require additional site preparation to prevent equipment and structures from sinking.
- Long supply lines and limited transportation access from the world's manufacturing centers require equipment redundancy and a larger inventory of spare parts to ensure reliability, while increasing transportation costs.
- Employees expect higher wages and salaries to work in the isolated and inhospitable Arctic.
- Natural gas hydrates can pose operational problems for drilling wells in both onshore and offshore Arctic areas.
Overlapping and disputed claims of economic sovereignty between neighboring jurisdictions also could be an obstacle to developing Arctic resources. The area north of the Arctic Circle is apportioned among eight countries—Canada, Denmark (Greenland), Finland, Iceland, Norway, Russia, Sweden, and the United States. Under current international practice, countries have exclusive rights to seabed resources up to 200 miles beyond their coast, an area called an Exclusive Economic Zone (EEZ). Beyond the EEZ, assessments of "natural prolongation" of the continental shelf may influence countries' seabed boundaries.
Along with economic and political challenges, environmental stewardship and regulatory permitting may also affect timelines for exploration and production of Arctic resources. Environmental issues include the preservation of animal and plant species unique to the Arctic, particularly tundra vegetation, caribou, polar bears, seals, whales, and other sea life. The adequacy of existing technology to manage offshore oil spills in an arctic environment is another unique challenge. Spills among ice floes can be much more difficult to contain and clean up than spills in open waters.
See further information on the Arctic's energy resources and the challenges associated with their development in the December 21, 2011 edition of This Week In Petroleum.
TraderSmarts Premium Swing Trade Alerts
Saturday, January 21, 2012
ONG: Crude Oil Weekly Technical Outlook For Saturday January 21st

In the bigger picture, pull back from 114.83 was completed at 74.95 already and medium term rally from 33.2 is not finished yet. We'd tentatively treat rise from 74.95 as resuming of such rally. Sustained break of 114.83 will target 61.8% projection of 33.2 to 114.83 from 74.95 at 125.40. On the downside, though, break of 92.52 support will indicate that correction pattern from 114.83 is going to extend further with another falling leg to 74.95 and below before completion.
In the long term picture, crude oil is in a long term consolidation pattern from 147.27, with first wave completed at 33.2. The corrective structure of the rise from 33.2 indicates that it's second wave of the consolidation pattern. While it could make another high above 114.83, we'd anticipate strong resistance ahead of 147.24 to bring reversal for the third leg of the consolidation pattern.
Nymex Crude Oil Continuous Contract 4 Hour, Daily, Weekly and Monthly Charts
Gold Trend Forecast for the 1st Quarter of 2012
Friday, January 20, 2012
OilPrice: China to Aid Saudi Arabia in Nuclear
In February 1945, after the Yalta Conference with Soviet General Secretary Iosif Stalin and British Prime Minister Winston Churchill, on his way home U.S. President Franklin Delano Roosevelt and King Ibn Saud met aboard the New Orleans class heavy cruiser U.S.S. Quincy in the Suez Canal’s Great Bitter Lake. During the meeting, instigated by Roosevelt, he and Ibn Saud concluded a secret agreement in which the U.S. would provide Saudi Arabia military security, including military assistance, training and a military base at Dhahran in Saudi Arabia, in exchange for secure access to supplies of oil.
Sixty seven years later, my, how things have changed, as China is now muscling into the Kingdom of the Two Holy Places.
On 15 January Visiting Chinese Premier Wen Jiabao and Saudi Arabian King Abdullah bin Abdul Aziz agreed to make concerted efforts to enhance bilateral relations. The spectacle of OPEC’s leading petro-state and East Asia’s superpower economy making common cause has surely caused the burning of the midnight oil inside the Beltway.
While Wen said that China is willing to strengthen coordination with Saudi Arabia on all major issues by expanding cooperation in trade, investment, infrastructure, high-tech, finance, security and law enforcement, what must have surely caught the eye of Washington’s mandarins was him adding that China intends to develop a cooperative partnership with Saudi Arabia in the energy sector.
And why not? Saudi Arabia is the largest supplier of oil to China and bilateral trade between the two countries soared to $58.5 billion in the period January-November 2011.
And the fruits of such bilateral proximity were on the table even before Wen made his fulsome remarks, as the state-owned Saudi Press Agency reported on 14 January that Saudi state oil giant Aramco has signed an agreement with state owned giant China Petroleum and Chemical Corporation Ltd. (Sinopec) to build an oil refinery, named Yasref, in the Red Sea city of Yanbu, which will become operational in 2014, processing 400,000 barrels per day.
What is really going to catch Washington’s and the foreign investment community’s attention is how the agreement is structured, Saudi Aramco will hold a 62.5 percent stake with Sinopec holding the remainder.
In one of 2012’s greatest understatements, Aramco president and CEO Khalid al-Falih said that the contract "represents a strategic partnership in the refining industry between one of the main energy producers in Saudi Arabia and one of the world's most important consumers."
Continuing his victory lap around the western shores of the Persian Gulf, Wen will also visit Qatar and the United Arab Emirates, two other stalwart U.S. allies.
And the eastern side of the Gulf?
Commenting on Iran, China’s third largest source of oil imports, on 11 January Chinese Foreign Ministry spokesman Liu Weimin said at a press briefing that China will maintain its trade ties with Iran despite efforts by U.S. Treasury Secretary Timothy Geithner to convince Beijing to join a proposed embargo of Iranian oil exports.
But perhaps the most intriguing element of the Riyadh-Beijing lovefest was the announcement that on 15 January Saudi Arabia signed an agreement with China for cooperation in the development and use of atomic energy for peaceful purposes, an event of significant importance that both Abdullah and Wen attended.
No comment is really needed here, except to note that many of the questions asked about Iran’s civilian nuclear power program, such as why does a leading "petro state" need nuclear energy, are unlikely to be asked about this particular venture, underling that once again, reality in the Middle East is whatever your perceptions tell you in advance it is.
Posted courtesy of John C.K. Daly at Oilprice.com
Get our gold trend analyst for the 1st Quarter of 2012
Thursday, January 19, 2012
Crude Oil Bulls Gaining Much Needed Momentum

If March renews this month's decline, December's low crossing at 92.95 is the next downside target. First resistance is this month's high crossing at 103.90. Second resistance is the 75% retracement level of the 2011 decline crossing at 105.23. First support is last Friday's low crossing at 97.93. Second support is December's low crossing at 92.95.
The consolidation in crude oil above the $98 a barrel level continues. We are longer term positive on this market, however it must move over resistance at $104 to get upside momentum into high gear. With a Chart Analysis Score of +90, this market is in a strong trend and with all our Trade Triangles in a positive mode we expect we will see this market breakout to the upside. Long and intermediate term traders should be long this market with appropriate money management stops.
Check out our gold trend forecast for the 1st quarter of 2012
Wednesday, January 18, 2012
Crude Oil, Gold and Natural Gas Mid Week Market Commentary For Wednesday January 18th
Crude oil [March contract] closed lower on Wednesday as it consolidates some of Tuesday's rally. The mid-range close sets the stage for a steady opening on Thursday. Stochastics and the RSI are neutral to bearish signaling that sideways to lower prices are possible near term. If March extends last week's decline, December's low crossing at 92.95 is the next downside target. If March renews the rally off December's low, the 75% retracement level of the 2011 decline crossing at 105.23 is the next upside target. First resistance is this month's high crossing at 103.90. Second resistance is the 75% retracement level of the 2011 decline crossing at 105.23. First support is last Friday's low crossing at 97.93. Second support is December's low crossing at 92.95.
February natural gas posted an inside day with a lower close on Wednesday as it extends the multi year decline. Stochastics and the RSI are oversold but remain bearish signaling that sideways to lower prices are possible near term. If February extends the aforementioned decline, monthly support crossing at 2.409 is the next downside target. Closes above the 20 day moving average crossing at 2.966 are needed to confirm that a short term low has been posted. First resistance is the 10 day moving average crossing at 2.819. Second resistance is the 20 day moving average crossing at 2.967. First support is Tuesday's low crossing at 2.439. Second support is monthly support crossing at 2.409.
Gold closed higher on Wednesday as it extends the rally off December's low. The high range close sets the stage for a steady to higher opening on Thursday. Stochastics and the RSI are overbought but remain neutral to bullish signaling that sideways to higher prices are possible near term. If April extends the rally off December's low, the 38% retracement level of the September-December decline crossing at 1678.70 is the next upside target. Closes below the 20 day moving average crossing at 1614.30 would temper the near term friendly outlook. First resistance is Tuesday's high crossing at 1670.80. Second resistance is the 38% retracement level of the September-December decline crossing at 1678.70. First support is the 20 day moving average crossing at 1614.30. Second support is December's low crossing at 1526.20.
Gold Trend Forecast for the 1st Quarter of 2012
Tuesday, January 17, 2012
The Dollar, Weak Earnings Indicate a Top is Near For The S&P 500
Earnings season is now upon us and so far the only major earnings component that has been released is the J.P. Morgan earnings report that came in Friday before the market opened. After the report was digested by the marketplace, prices fell dramatically.
While the charlatans in Washington try to sell the American public into believing that the U.S economy is starting to firm up, the underlying truth is that the recovery has been relatively weak. If it were not for the massive liquidity injections provided by the Federal Reserve through multiple quantitative easing adjustments, risk assets would likely be priced significantly lower.
Inquiring minds combed through the data provided in the J.P. Morgan earnings release and a few major outcomes were placed front and center. Earnings disappointed overall due to a massive decline in investment banking activity. Investment banking profits represent a large portion of all of the major banks’ earnings.
On Friday the guys at Zero Hedge provided the following chart in its article titled, “Charting Disappearing Investment Banking Revenues And Profits, JPM Edition.” The chart below illustrates the massive decline in investment banking revenue:

To make the chart a bit easier to follow, the blue bars represent investment banking revenue. It is rather obvious that investment banking revenue is in free fall having dropped nearly 50% since the first quarter of 2011. In addition, I would point out the sharp declines in total net income (purple) and the massive decline in equity market revenue (green).
It is without question that the other major banks that have a large investment banking presence are likely to experience similar revenue losses. A significant reduction in investment banking gross revenue puts tremendous pressure on total bank revenues in this quarter and looking ahead.
I am of the opinion that major money-center banks like Bank of America and Citigroup are likely to experience similar revenue reductions. We will know for sure in the coming weeks as most of the large banks are set to report earnings in the near term. Clearly this expected reduction in overall revenue will likely have a major impact on the financial sector of the economy.
The financial complex is absolutely critical when looking at broad index returns. It is common knowledge that broad indexes such as the S&P 500 and the Dow Jones Industrial Average struggle to rally when the financial complex lags. The same can be said for the semiconductor sector as well.
Recently financials (XLF) and the semiconductor (SMH) sectors have worked considerably higher on relatively light volume. Both XLF and SMH are trading into major resistance and both are starting to show signs that they are nearing a potential top The daily charts of XLF and SMH are shown below:
XLF Daily Chart

SMH Daily Chart

Both the XLF and SMH daily charts illustrate that a major top may be forming in both sectors. It is widely noted that if the financials and semiconductors are not showing strength in a rising market, a correction or major reversal may not be far away.
I have been writing about the potential for a major top to be forming for several weeks now and I find that I am not in the majority in this viewpoint. Recent sentiment and momentum in U.S. equities demonstrate that we are very overbought at this time. Retail investors are extremely bullish and the Volatility Index (VIX) is trading near recent lows.
I am unsure whether this is a major top that leads to strong selling pressure or whether a correction is a more likely outcome. What I do know is that tops are a process, not a singular event and at this point more and more evidence is supporting the viewpoint that equities may be getting tired and some profit taking is likely.
In addition to the lackluster price action in the charts above, earnings releases have been revised lower in the 4th quarter of 2011. In fact almost 3.5 companies have announced earnings revisions to the downside for every company that has indicated a stable to rising earnings announcements. This type of scenario has not been present since the first quarter of 2008 which as we know was not exactly a great time frame to be looking to put cash into risk assets.
Furthermore, Goldman Sachs analysts came out with the following commentary, “While the 4th Quarter is typically the strongest quarter for earnings, estimates have fallen 9% since the summer and are now below both realized 2nd and 3rd Quarter results.” Goldman Sachs is also expecting significant price pressure coming from a weak U.S. economy and the fears of a European recession in 2012. Overall, the estimates are far from bullish and are in fact quite concerning when looking at the current valuation of U.S. equities.
The impact that a stronger U.S. Dollar will have on domestic companies which are used to having a competitive advantage when looking at earnings due to currency adjustments could produce negative surprises. Typically positive earnings adjustments are likely to be revised to the downside as the U.S. Dollar has rallied sharply higher in light of the weakening Euro currency. The weekly chart of the U.S. Dollar Index is shown below:

The U.S. Dollar Index is consolidating directly beneath resistance which is generally seen as a bullish development. I expect a breakout over new highs is only a matter of time. It is unlikely that in the long term the U.S. Dollar can rally while stocks trade flat or work their way higher. While this is always possible, the likelihood of that scenario is unlikely due to earnings pressures that would occur if the Dollar pushes higher in the intermediate term.
In addition to the variety of above mentioned factors which could have a major impact on equity valuations, the S&P 500 Index is trading into major resistance. Unless the S&P 500 Index can work above the 1,325 area it is unlikely that a new bull market has begun.
If the S&P 500 Index manages to work above the 1,325 level then my analysis may be proven completely incorrect. However, right now the S&P 500 Index has a lot of overhead resistance at the 1,292, 1,300, and 1,310 price levels. The daily chart of the S&P 500 Index is shown below’

Ultimately we are coming into the final week for the January options contracts which are set to expire at the close of business this coming Friday. I would not be shocked to see some volatility late this week and potentially even higher prices for equities.
However, my expectation is that once the January expiration hangover is behind us, increased volatility and lower prices are likely ahead for U.S. equities. The earnings announcements this week will likely have a large impact on the price action. Heads up, risk is exceptionally high!
Check out J.W.s latest articles
Crude Oil Closes Higher But Bears Maintain the Momentum
February crude oil closed higher on Tuesday as it consolidates some of last week's decline. The high range close sets the stage for a steady to higher opening on Wednesday. Stochastics and the RSI remain bearish signaling that sideways to lower prices are possible near term. If February extends last week's decline, December's low crossing at 92.70 is the next downside target.
If February renews the rally off December's low, the 75% retracement level of the 2011 decline crossing at 104.84 is the next upside target. First resistance is this month's high crossing at 103.74. Second resistance is the 75% retracement level of the 2011 decline crossing at 104.84. First support is last Friday's low crossing at 97.70. Second support is December's low crossing at 92.70.
Gold Trend Forecast for the 1st Quarter of 2012
Sunday, January 15, 2012
Gold Trend Forecast for the 1st Quarter of 2012
Over the past five months gold has fallen sharply and is no longer headline news which it once dominated back in 2011 when it was making new highs every day. The shiny metal has been under pressure because traders and investors started to pull some money off the table to lock in gains.
Gold prices had surged so fast most advanced traders knew that final high volume surge was not sustainable. But the main reason gold topped out in my opinion was because the US Dollar index had put in a bottom and started to build a base. As we all know a rising dollar typically means lower stocks and commodity prices.
I have posted some charts below covering gold in detail using multiple time frames. The weekly which is long term, daily which is the intermediate trend and the 4 hour chart which shows gold momentum and intraday action. At the very bottom I talk about the US Dollar and what is happening with that.
Gold Weekly Long Term Trend Analysis
The weekly chart is not the most exciting time frame to follow as you will grow old watching it. That being said it is crucial for understanding the long term trend, price and volume analysis.
Below you can see that gold’s recent pullback has been a 3 wave correction, which is a normal pullback for any investment. But taking into account the rally from 2008 – 2011 I feel this pullback will have one more low put in before bottoming out. This would make for a 5 wave correction much like what happened in 2008.

Daily Chart of Gold Showing the Intermediate Trend
The daily chart allows us to see gold intra week price action and use the 150 moving average which is my preferred daily moving average. As you can see we are getting a similar pullback as 2008 with gold now trading under the 150 MA.
I would like to see gold make another lower low in the next 2-3 months. If that happens I feel it complete the correction and trigger a strong multi month or multiyear rally in gold.

4 Hour Intraday Chart of Gold
The 4 hour chart of gold allows us to see all the intraday price action which would normally not be seen with a daily chart. It also gives us enough data to build our analysis upon.
My preferred setup for gold which I feel if happens will trigger major buying in the yellow metal. If/when we get a rally in gold would also likely mean some more economic uncertainty has entered the market either from within the USA, Europe or China…

Weekly Dollar Index Long Term Analysis
The dollar has the potential to rally to the 87 – 88 level before putting in a major top. For this to happen we will need to see the Euro crumble (both currency and countries divide) in my opinion.
If you look at the weekly chart of gold and this chart of the dollar index you will notice that gold topped when the dollar bottomed. Over the past couple year’s gold and the dollar have had an inverse relationship to each other.
With all kinds of crap about to hit the fan overseas I think it’s very possible gold will rally with the dollar. Reason being there is way more people overseas who want to unload their euro’s and with all the negative talk and doubt with the US Dollar individuals will naturally want to buy more gold.

Weekend Trend Trading Conclusion:
In short, I expect a bumpy ride for both stocks and commodities in the first quarter of 2012. With any luck gold will pull back into my price zone shaking the majority of short term traders out just before it bottoms. And we will be positioning ourselves for a strong rally buying into their panic selling.
To just touch base on the general stock market quickly. I have a very bearish outlook for stocks. If the dollar continues to rise it is very likely the stock market will fall into a bear market. So I am VERY cautious with stocks at this time.
If you would like to receive my Weekly reports, updates and trading education videos each week join my free newsletter here at The Gold and Oil Guy
Chris Vermeulen
Saturday, January 14, 2012
ONG: Weekly Fundamentals..... Geopolitical Tensions Drive Crude Oil Volatility
Geopolitical tensions have been directing the movement of oil prices since the start of the year. Sanctions against Iran in condemnation of its nuclear developments had sent oil prices higher. The US has imposed sanctions against Iran's central bank and it's highly likely that Japan and South Korea will reduce their imports of Iranian oil. The EU has in principle agreed ton an embargo on oil imports.
However, an EU embargo on Iranian oil imports will likely be delayed for 6 months so that countries including Greece, Italy and Spain can find alternative supplies. Data from the European Commission indicated that these three countries accounted for 68.5% of EU imports from Iran in 2010. The news triggered a sharp selloff in oil prices on Thursday and Friday. In Nigeria, President Goodluck Jonathan will meet protesters in an attempt to end the 4 day strike which will affect the oil industry. Oil prices should continue to move with great volatility in coming months as long as geopolitical tensions remain uncertain.

The DOE/EIA released its monthly short-term energy report last week, suggesting the price of WTI crude oil would average about 100/bbl in 2012, up +5/bbl from the average price last year. For 2013, the agency expects WTI prices to 'continue to rise, reaching 106/bbl per barrel in the fourth quarter of next year". Concerning global oil demand/supply, the DOE/EIA expects the tightening of world oil markets would 'moderate in 2012 and resume in 2013'.
Oil demand will probably increase +1.27 mmb, or +1.44% y/y, to 89.38 mmb in 2012. This, however, represents a -0.14 mmb drop from the projection made in December. The DOE/EIA also introduced the demand forecast for 2013. During the year, consumption will climb +1.47 mmb, or +1.44% y/y, to 90.85 mmb. On the supply side, non-OPEC supply is expected to rise +0.91 mmb, or +1.76%, y/y to 52.76 mmb in 2012, followed by a +0.76 mmb, or +1.44%, increase to 53.52 mmb in 2013. The need for oil supply from the OPEC will be 30.30 mmb and 30.76 mmb in 2012 and 2013 respectively.
Friday, January 13, 2012
Is This Pullback in Crude Oil a Buying Opportunity?

If February renews the rally off December's low, the 75% retracement level of the 2011 decline crossing at 104.84 is the next upside target. First resistance is last Wednesday's high crossing at 103.74. Second resistance is the 75% retracement level of the 2011 decline crossing at 104.84. First support is today's low crossing at 97.70. Second support is December's low crossing at 92.70.
The pullback in the crude oil market is setting up a buying opportunity once the downward momentum is over. A solid close over the $104 level is needed to drive this market to the $120 level. External world events can trigger moves in this commodity. With a Chart Analysis Score of +55, this market is now in a trading range. The crude oil market has major resistance at $104 and support at $97. Long and intermediate term traders should be long this market with appropriate money management stops.
Get our current Market Trend Forecasts
Rigzone: Crude Oil Falls As Euro Zone Woes Resurface
Crude futures fell Friday in tandem with a slumping euro as Standard & Poor's prepared to downgrade France's credit rating, adding new fears about Europe's economy.
The ratings service notified the French government and other European governments that it will lower their debt ratings, according to reports Friday, sending the euro to 16 month lows against the dollar and taking the wind out of riskier assets such as oil, stocks and other commodities.
The news of imminent downgrades renewed worries about a potential stumbling block for the global economy, and oil demand. Traders quickly switched gears to focus on Europe's credit crisis after a sell-off Thursday was sparked by potential delays to the E.U. embargo on Iranian oil.....Read the entire Rigzone article.
Phil Flynn: To Embargo or not to Embargo, That is Indeed the Question
While the market got a boost on reports that European refiners were meeting with Saudi Arabia and other oil producers and securing an alternative to Iranian oil supply, apparently some in the EU did not like the answers that they heard. An overbought oil market seemingly got a reason to sell-off on a Bloomberg report that the European Union embargo on imports of Iranian oil will likely be delayed for six months to allow countries such as Greece, Italy and Spain to find alternative supply, quoting an EU official with knowledge of the talks and it hit the market at just the right time.
The truth is, as I have said before, the EU would like to put off an embargo until after winter and Italy still wants some of the money that the Iranians owe them. Still do not think that Iran will be able to sell their oil very easily. The bottom line is that all Iranian oil will be sold, but it will be sold at a discount. Is it any wonder that Iran is rattling that saber to keep prices high. They are hopping if they can keep prices artificially high they won't miss the loss of revenue! Which means it will be a saber rattling kind of weekend! With a three day holiday in the US, being short over the weekend might be a dangerous propostion.
Yet Bloomberg News is reporting that.....Read the entire article.
Candlestick Formations You Need To Learn
ONG: Sharp Move Dominates Oil Market, Bears Take the Momentum
Sharp moves dominated yesterday's session, where oil rallied to acquire our targeted area near 103.00 before reversing sharply again to breach the bearish technical pattern shown on image in addition to 100.10 support. Currently, price is testing the breached level again which turns into resistance after testing the main pivotal support at 98.50, but in general, trading remain within the same ranging stance. Today we may see another downside attempt as important technical levels were breached yesterday. The trading range for the day is expected among the major support at 96.00 and the major resistance at 102.00. The short term trend is to the downside with steady daily closing below 105.00, targeting 65.00.
Posted courtesy of Oil N' Gold | |||||||||||||||||||||||||||||||||||||||||||||||||||||||||||||||||||||||||||||||||||||||||||||||||||||||||||||||||||||||||||||||||||||

Could Crude Oil Prices Intensify a Pending SP 500 Sell Off?
Thursday, January 12, 2012
Crude Oil Bulls Lose Momentum on Sharp Drop
Crude oil closed sharply lower on Thursday and below the 20 day moving average crossing at 99.21 confirming that a short term top has been posted. The low range close sets the stage for a steady to lower opening on Friday. Stochastics and the RSI have turned bearish signaling that sideways to lower prices are possible near term. If February extends today's decline, the reaction low crossing at 98.30 is the next downside target.
If February renews the rally off December's low, the 75% retracement level of the 2011 decline crossing at 104.84 is the next upside target. First resistance is last Wednesday's high crossing at 103.74. Second resistance is the 75% retracement level of the 2011 decline crossing at 104.84. First support is the reaction low crossing at 98.30. Second support is December's low crossing at 92.70.
Get a FREE Preview of INO TV....The Leader in Trader Education
Subscribe to:
Posts (Atom)
