Showing posts with label stocks. Show all posts

Friday, February 17, 2023

Are You Ready For When Opportunity Knocks? Sprott PM Projections


Chris sits down with Craig Hemke of Sprott Money to talk about current opportunities and where the market may go next through the lens of technical analysis. By focussing on the price charts only, all additional news based noise falls away, and a clearer picture emerges about where an opportunity to invest exists....Continue Reading Here.

Monday, January 30, 2023

Is A Full Fledged Bear Market On The Horizon and The Rally In Precious Metals?

Chris Vermeulen sits down with David Lin of Kitco News to discuss the current market and asset class cycles – a very important concept to understand when positioning investments. Looking at the stages of the market and the emotions of investors and trades, the question comes up of whether we are about to start a new bull market or are hovering on the edge of a complacency phase, about to tip into a full-fledged bear market....Continue Reading Here.

Thursday, January 12, 2023

Monthly Outlook For Precious Metals Super Cycle - Today’s Free Video

Chris Vermeulen discusses the current state of various markets, including the stock market, and suggests that there may be a bear market on the horizon. 

He also discusses the potential for a “supercycle” in precious metals, specifically gold and silver, and suggests that there may be opportunities for investment in these areas....Watch Video Here.


Friday, December 16, 2022

Stock Indexes Rejected At Resistance Signal Another Correction

Stocks struggled with overhead resistance for the past week. While seasonal trends usually favor a year end rally, this year’s rally may already have finished. January will be the month to watch. If the market closes with a positive January, we almost always have a strong year for stocks. 

But if not, we could be in for a doozy of a bear market in the first half of 2023. This week we had more hawkish Fed talk on Wednesday, suggesting that rates will remain higher for a longer period of time....Continue Reading Here.

Monday, November 28, 2022

After This Holiday Rally, You Better Know When To Walk Away

This week’s investor insight will make you think twice about the current stock and bond rally as we head into the end of the year.

We get a lot of questions about if the stock market has bottomed or if it is headed lower and how they can take advantage of the next Major market move. Over the next 6 to 12 months, I expect the market to have violent price swings that will either make or break your financial future. So let me show a handful of charts and show what I expect to unfold.

Let’s dive in....Continue Reading Here.

Sunday, October 2, 2022

Gold Starting Stage 4 Decline: What Does This Mean For Investors?

It has been an interesting year, with stocks down nearly 25% and the bond ETF TLT down over 40% since the 2020 highs. 

The passive buy and hold investor is becoming panicked, and we can see this in the stock market through the mass selling of utility stocks, dividend stocks, and bonds. 

When the masses become fearful, they liquidate nearly all assets in their portfolios which is why we see the Big Blue chip stocks selling off along with precious metals. 

As investors liquidate around the world, they focus on where their money can still be preserved. With most currencies falling in value, there is a flood toward the U.S. dollar index as the safety play....Continue Reading Here.

Tuesday, August 30, 2022

New Gold Apex Pattern - How Will The U.S. Fed Rate Decision Affect This?

My research shows a new Gold Apex pattern is set up for September 11th - 15th. Around September 11th or after, Gold will attempt to reach this new Apex level near $1766. This price pattern is important because the US Fed rate decision date is September 20th - 21st, and a host of economic data reporting comes out the week before the Fed decision.

My educated guess is Gold & Silver will begin a volatile breakout move, possibly rolling lower to retest support near $1672, before attempting to move higher as global fear starts to elevate. I believe the current lower support level is critical to understanding the opportunities in Gold. If the $1672 level is breached to the downside, it means that Gold has lost a critical support level and will likely trend lower....Continue Reading Here.

Thursday, August 18, 2022

Crude Oil Prices - Will They Hold Above Key Support Level Or Begin To Unwind?

Talk of a global recession may prompt a broad decline in crude oil prices as the excesses of the past 10+ years unwind. This unwinding process pushed to the forefront for traders and investors has been prompted by a massive inflationary expansion after the COVID-19 lock downs. How will it play out in the short term and long term?

We believe crude oil will contract as the initial reduction in demand associated with high priced gasoline and oil products and the threat of a global recession recede. This decline in crude oil prices is complicated as China/Asia economic and COVID crisis events continue to disrupt consumer discretionary income and asset valuation levels.....Continue Reading Here.


Thursday, June 23, 2022

Crude Oil Breaks Downward – Rejecting The $120 Price Level

The recent downward Crude Oil trend may have caught many traders by surprise. Just before the US Fed raised interest rates on June 15, 2022, Crude oil was trading above $120ppb. Less than 5 days later, it collapsed -12% and has continued to trend lower. Currently, Crude Oil is near -17% lower than recent highs.

It appears Crude Oil has confirmed resistance near $120 and is devaluing as consumers pull away from traditional driving/spending habits while the Fed aggressively attempts to burst the inflation bubble. This type of contraction in Crude Oil is very similar to what happened in 2008-09 when the Global Financial Crisis (GFC) hit – Crude Oil collapsed more than -70% after IYC started trending lower in 2007....Continue Reading Here

Tuesday, April 12, 2022

Utilities Rising & Transporters Sinking - Sector Rotation Is Providing Clues

Historically, investors gravitate toward more defensive and commodity focused sectors, such as precious metals, energy, commodities, and utilities, in late cycle bull markets. Recently, the stock market is beginning to show us signs that the bull market may be coming to an end. 

Commodities such as energy, grains, and precious metals have all experienced nice rallies. Price action also confirms money flow coming out of transports and into utilities....Continue Reading Here.

Tuesday, April 5, 2022

Waiting For GLD To Make New Highs - Gold Rally Is Still Intact

The calm of the last 3 weeks has resulted in a risk on environment. This, in turn, has led to a nice recovery rally in stocks. For the time being, volatility has subsided. However, we believe there are many underlying market risks that can still resurface without any warning.

From late 2015 to August 2020, the price of gold doubled, going from approximately $1040 to $2080. Gold then experienced a profit taking $400 pullback. Gold’s rally over the past 12 months failed to break through its $2080 price level. After retreating back to $200, gold seems to have found support at the $1900 level.

In reviewing the following spot gold chart, it appears we have broken out of an accumulation phase and seem to be preparing to move above the $2080 high.....Continue Reading Here.

Thursday, March 10, 2022

How You Can Minimize Trading Risk & Grow Capital During A Global Crisis

To minimize trading risk and grow capital during a global crisis is somewhat hinged on the answers to speculative questions. 
  • How long will the Russia – Ukraine war last? 
  • How high is the price of oil and gas going to go? 
  • How quickly will central banks raise interest rates to counter high inflation? 
  • What assets should I put my money into? 
Knowing what the Best Asset Now (BAN) is, is critical for risk management and consistent growth no matter the market condition. Buy the Dip or Sell the Rally? Let's start here with the DJI weekly chart

Tuesday, February 15, 2022

Stocks Fall as Gold and Oil Jumps Amid Tension Over Ukraine - FED

The FED has made it very clear that it will raise its benchmark interest rate, the federal funds rate. This could have severe consequences and even lead to a financial crisis. They are too far behind the curve and will be labeled a major policy error in the future, most likely. They have put themselves in a situation where they are now their own hostage. They need more leadership to describe what a soft landing is going to look like. They have been too slow to act, and now they are going too fast. The “Powell Put” has now been put out to pasture.

We believe that the FED will make more rate hikes than they have announced. Goldman Sachs thinks there will be four 25-basis-point increases in the federal funds rate in 2022. Jamie Dimon, CEO of JPMorgan Chase, said, “he wouldn’t be surprised if there were even more interest rate hikes than that in 2022. There’s a pretty good chance there will be more than four. There could be six or seven. I grew up in a world where Paul Volcker raised his rates 200 basis points on a Saturday night.”

Mr. James Bullard of the St. Louis FED spoke out in an arrogant tone that aggressive action is now required. The markets translated this to mean that the FED was going to call an emergency meeting as soon as this coming week to hike interest rates by no less than 50 basis points. This sent interest rates soaring and stock prices plummeting.....Read More Here


Saturday, January 29, 2022

Fed Comments Help To Settle Global Market Expectations

The recent Fed comments should have helped settle the global market expectations related to if and when the Fed will start raising rates and/or taking further steps to curb inflation trends. 

Additionally, the Fed has been telegraphing its intentions very clearly over the past few months, providing ample time for traders and investors to alter their approach to pending monetary tightening actions. Read the full Fed Statement here.

In my opinion, foreign markets are more likely to see increased risks and declining price trends for two reasons. 

First, at risk nations/borrowers struggle to reduce debt levels. 

Second, foreign market traders/investors struggle to adapt to the transition away from speculative “growth” trends. 

I think the U.S. Dollar may continue to show strength over the next 4+ months as the foreign traders pile into U.S. economic strength while the Fed initiates their tightening actions.

So it makes sense to me that global markets would recoil from Fed tightening while debt-heavy corporations/nations seek relief from rising debt obligations....Continue Reading Here.


Thursday, November 18, 2021

Screening Key Technicals To Select Option Trade Types

Controlling portfolio beta, which measures overall systemic risk of a portfolio compared to the market, on the whole, is essential as these markets continue to break record high after record high with violent pullbacks. 

The month of September was a prime example as the markets pushed to new all time highs early in the month then suffered a deep sell off to only bounce back to new record highs in October. 

Controlling beta while generating in line or superior returns relative to the market is the goal with an options based portfolio. A beta controlled portfolio can be achieved via a blended options based approach where ~50% cash is held in conjunction with long index based equities and an options component. 

Options alone cannot be the sole driver of portfolio appreciation; however, options can play a critical component in the overall portfolio construction to control beta....Read More Here.


Stock & ETF Trading Signals

Sunday, October 10, 2021

Where The SP500 Is Headed Next Week

Everyone wishes they knew where the stock market was going to go next. What sector is going to rally? When is the subsequent market sell off? When and where to put your money to work are the questions strive to figure out. Nothing is perfect. You cannot predict the future, but if you follow something close enough, you can get a good feeling of where it’s headed next, based on what it has recently been doing.

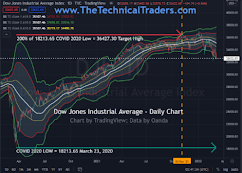
There are two moving averages here, the 50 day and the 20 day moving average. When the price is above these moving averages in general, and they’re sloping upwards, this means the market is most likely going to continue to trend higher.

When the price is sloping down, the price is below the moving average, and the 20 day moving average is below the 50 day, just what the market is doing this week; this tells us that there’s actually a mixed market signal. The market is struggling and in a new. As the saying goes, “the trend is your friend,” so it’s always best to trade with the market trend for the chart time frame you are following....Continue Reading Here


Stock & ETF Trading Signals

Friday, August 20, 2021

How To Trade When There Is Panic Selling In The Market

Straight from me to you – what you should do when panic selling hits the market. Should you follow the pack or hold firm?

As technical traders when all indicators are saying to get out of the market, then this is exactly what should be done. We do not fight a downward trend that is more likely to continue in that direction than it is to reverse. Do I like selling at a loss, of course not. But holding positions when all indicators are saying to sell is not a smart move – it’s an emotional one.

When fear hits the market and panic selling commences, yet all indicators show that the overall market remains in an uptrend, it’s best to hold on through the wave. The market will shake out those who caved to emotion and gave the sell orders to their brokers. To learn more about what to look for and how to trade when there is panic and fear....Listen to the Report Here.


Stock & ETF Trading Signals

Friday, June 4, 2021

Learn How to Take Advantage of Volatility And Profit From It

Volatility is the most common way to measure risk in the financial markets. While there are a plethora of methods, calculations, and derivatives to calculate volatility, they are all trying to accomplish the same goal: what is the price of a security going to do in the future? Without a crystal ball, there’s no perfect answer, but let’s go through a few common ways that we can estimate future volatility.

Let’s Talk Volatility

Generally speaking, there are two types of volatility that traders and investors use in an effort to understand risk – historical volatility and implied volatility....Continue Reading Here.
 

Stock & ETF Trading Signals

Sunday, April 4, 2021

Find Out Which ETFs Will Benefit From as a Stronger U.S. Dollar Reacts to Global Market Concerns

The recent news of Hedge Fund and other institutional crisis events has opened many eyes as investors and traders realize the post 2008-09 global market credit bubble has extended well beyond what many people may realize. 

Recent news that China offered a “deferment” for Chinese corporations and state run enterprises content with shadow banking credit/debt issues at a time when China is tightening monetary policy shows that a process, like the 2008 Lehman incident, may be setting up where institutional level credit/debt liabilities ripple through the global markets as global central banks attempt to reign in monetary policies.

This process is not likely to happen suddenly though. If this type of contraction in global monetary policy takes place, resulting in increased pressures to contain excessive credit/debt functions in the markets, then we believe the process may result in an extended 9 to 16+ months of “hit-and-miss” events leading up to a potentially bigger event. 

The Archegos Fund forced unwinding of trades hit the markets recently as a wake-up call. Prior to the Archegos event, the Greensill Capital collapse shocked the global markets because of the size and scope of this failure. Now, we see Credit Suisse issuing warnings that Q1 earnings may have taken a big hit because of exposure to the Greensill and Archegos assets – which is leading to Credit Suisse attempting to put the Gupta Trading Unit into insolvency....Read More Here.

Sunday, March 28, 2021

How to Spot Boom and Bust Cycles

One of the most important aspects of trading is being able to properly identify major market cycles and trends. The markets will typically move between four separate stages: Bottoming/Basing, Rallying, Topping/Distribution, and Bearish Trending. Each of these phases of market trends is often associated with various degrees of market segment trending as well. 

 For example, one of the most telling phrases of when the stock market is nearing an eventual Topping/Distribution phase is when the housing market gets super-heated. Yet, one of the most difficult aspects of this Excess Phase rally trend is that it can last many months or years, and usually longer than many people expect.

When an Excess Phase rally is taking place in the stock market, we expect to see the Lumber vs. Gold ratio moving higher and typically see the RSI indicator stay above 50. Demand for lumber, a commodity necessary for building, remodeling, and other consumer essential spending, translates well as an economic barometer for big ticket consumer spending. 

Extreme peaks in this ratio can often warn of a pending shift in consumer spending and how the stock market reacts to an Excess Phase Peak. Let’s take a look at some of the historical reference points on this longer term Weekly Lumber vs. Gold chart....Read More Here.

Stock & ETF Trading Signals