November crude oil closed lower on Monday. The high range close sets the stage for a steady to higher opening when Tuesday's night session begins. Stochastics and the RSI are oversold but remain neutral to bearish signaling that sideways to lower prices are possible near term. If November extends the decline off June's high, the 62% retracement level of the 2009-2011 rally crossing at 80.80 is the next downside target. Closes above the 20 day moving average crossing at 90.64 are needed to confirm that a low has been posted. First resistance is the 10 day moving average crossing at 88.63. Second resistance is the 20 day moving average crossing at 90.64. First support is last Friday's low crossing at 83.15. Second support is the 62% retracement level of the 2009-2011 rally crossing at 80.80.
We made the arrangements for a FREE MarketClub Trial....It’s been paid for!
November Henry natural gas closed higher on Monday as it consolidates some of last week's losses. The high range close sets the stage for a steady to higher opening when Tuesday's session begins trading. Stochastics and the RSI are oversold but remain neutral to bearish signaling that sideways to lower prices are possible near term. If November extends last week's decline, September's low crossing at 3.812 is the next downside target. Multiple closes above the late August high crossing at 4.163 are needed to confirm an upside breakout of the late summer trading range. Closes below July's low crossing at 3.786 would confirm a downside breakout of the late summer trading range. First resistance is the reaction high crossing at 4.184. Second resistance is the reaction high crossing at 4.487. First support is September's low crossing at 3.812. Second support is July's low crossing at 3.786.
Todays Top Dividend Plays, Stock and ETF....Just Click Here
December gold closed higher on Monday as it extends this month's short covering rally. The high range close sets the stage for a steady to higher opening when Tuesday's night session begins trading. Stochastics and the RSI are neutral to bullish signaling that sideways to higher prices are possible near term. If December extends this month's rally, the 38% retracement level of the July-October decline crossing at 1246.00 is the next upside target. Closes below the 10 day moving average crossing at 1214.20 would confirm that a short term top has been posted. First resistance is the 38% retracement level of the July-October decline crossing at 1246.00 . Second resistance is the 50% retracement level of the July-October decline crossing at 1265.50 . First support is October's low crossing at 1183.30. Second support is monthly support crossing at 1179.40.
Here's our simple method to "Bring Your Portfolio into the 21st Century"
December coffee closed lower due to profit taking on Monday. The low range close set the stage for a steady to lower opening on Tuesday. Stochastics and the RSI are overbought but remain neutral to bullish signaling that sideways to higher prices are possible near term. If December extends the rally off September's low, weekly resistance crossing at 24.30 is the next upside target. Closes below the 20 day moving average crossing at 19.79 are needed to confirm that a top has been posted.
Get our latest FREE eBook "Understanding Options"....Just Click Here!
Showing posts with label portfolio. Show all posts
Showing posts with label portfolio. Show all posts
Monday, October 13, 2014
Thursday, September 11, 2014
Floating Rate Funds Poised to Profit as Interest Rates Rise
By Andrey Dashkov
Money can’t be this cheap forever. In other words, one of the most likely scenarios the U.S. economy faces is rising interest rates. The current low interest rate climate is simply unsustainable. At some point—as it always does—the trend will turn around. We want to be prepared for that turn, and the right floating-rate fund can help.A floating rate loan is a bank loan with interest that’s tied to some benchmark rate, often the London Interbank Offer Rate (LIBOR). When the LIBOR changes, so does the loan’s coupon. The rate is adjusted every 30 - 90 days. Floating rate funds are pools of capital that invest in these loans, earn variable-rate interest, and pay dividends that are themselves flexible.
Variable Dividends Boost Immunity
A note of caution is in order here: Even though floating rate bonds don’t have the same inverse price-yield relationship as fixed rate debt instruments, their prices can still go down. Although the automatic coupon adjustments mostly eliminate the first major risk of any debt instrument—interest-rate risk—floating-rate funds still hold the other major risk: credit risk. As a reminder, credit risk is the risk that the borrower won’t make payments on time or will default on the debt entirely.
The credit risk of floating rate loans is high because the companies that borrow under these conditions are usually rated below investment grade. They can’t go to capital markets for money because fixed rate loans would be too expensive, so they turn to banks that provide funds on floating rate terms.
Since the companies borrowing these funds are below investment grade, their default rates are close to those of speculative grade bonds. Vanguard Research reports that the average annual default rate from 1996 to 2012 for speculative grade bonds was 4.5%; for senior floating-rate loans, it was 3.4%. Better, but still much higher than investment-grade bonds at 0.1%.
High Post - Default Recovery Rates
Second, floating rate loans outperform both high yield loans and the aggregate U.S. bond market. According to Vanguard, during the last three rising rate periods (January 1994-February 1995, June 1999-May 2000, and June 2004-June 2006) floating rate bonds outperformed high yield instruments by 2.5 percentage points (pp) and the aggregate bond market by 4.3 pp.
After the rising rate periods end, however, floating rate funds tend to underperform both high yield instruments and the overall bond market. This is why we’re buying them now, when rates have nowhere to go but up. We don’t know when that will happen, but when it does, we want to be positioned to profit.
In addition to their excellent performance in rising interest rate periods, floating rate funds are good for diversification. Their correlation with the overall US bond market is close to zero, which makes them especially good for a portfolio focused on fixed-rate US bonds. However, they also belong in our retirement portfolio—the Money Forever portfolio—where we use them to diversify our allocation across various debt instruments and to make sure we are well positioned to profit from rising interest rates.
Entrée into the World of Big Money
At Miller’s Money we closely monitor the bond market, constantly scouting out the best options for seniors and savers. Learn more need to know information about bonds and the role they play in today’s low-interest rate environment by downloading our free special report, Bond Basics today.
The article Floating-Rate Funds Poised to Profit as Interest Rates Rise was originally published at Millers Money
Make sure to check out our "Beginners Guide to Trading Options"....Just Click Here!
Thursday, August 21, 2014
Stop Investing in Leveraged ETFs
By Andrey Dashkov
Bigger, faster, better. That’s the turbocharged investment we all want. Miller’s Money Forever subscribers who pay close attention to our portfolio, though, will notice that we don’t hold leveraged ETFs—those with “2x” or “inverse” or “ultra” in their names, which some investors mistake for “better.”Exchange-traded funds (ETFs) are a great tool for many portfolios. They allow investors to profit from movements in a huge variety of assets grouped by industry, geography, presence in a certain index, or other criteria. You can find ETFs tracking automobile producers, cotton futures, or cows.
For our purposes, ETFs make it easier to diversify within a certain group of companies—easier because you don’t have to buy them individually. You buy the ETF and leave it to its managers to balance the portfolio when needed.
We have several ETFs in the Money Forever portfolio, and they have served us well so far. They expose us to several universes, such as international stocks, foreign dividend-paying companies, convertible securities, and others.
Why Turbocharged Isn’t Always Better
First, because we’re very cautious about volatility, and leveraged ETFs are designed to be less stable than the underlying assets. Second, there is a trick to leveraged ETFs that can make your investment in them stink even if the underlying index or asset does well.
Before we get to the details, let me pose two questions:
- If the S&P 500 goes up by 5% over several days, how much would a 2x leveraged ETF based on the index earn?
- If the S&P 500 goes up and down, then rises, and after a while ends up flat, will our ETF end up flat too?
To show how that works, here’s a brief example that will also answer question number two.
| Day # | Index Price | Daily Return | ETF Price | |
| Index | ETF | |||
| 1,900 | $100.00 | |||
| 1 | 1,800 | -5.26% | -10.53% | $89.47 |
| 2 | 1,870 | 3.89% | 7.78% | $96.43 |
| 3 | 2,000 | 6.95% | 13.90% | $109.84 |
| 4 | 1,900 | -5.00% | -10.00% | $98.86 |
| Total return | 0.0% | -1.1% | ||
| Source: TheTradeSurfer | ||||
What you’re looking at here is a hypothetical index with a value of 1,900 at the beginning of our period. It goes up and down for four days, and then is back to 1,900 by the end of day 4. There is also an ETF that starts with a price of $100 and doubles the daily gains of the index.
On the first day, the index goes down to 1,800 for a daily loss of 5.26%. This forces the daily loss of the ETF to be 10.53% (including rounding error), and the resulting price of the ETF is $89.47. The next day the index is up 3.89%, forcing the ETF to grow by 7.78%, to $96.43, and so on.
We designed this table to show that even though the underlying index is back to 1,900 in five days, returning 0% in total gain, the ETF is down 1.1% by the end of day 4.
It works like this because ETFs are designed to track daily returns, not mirror longer-term performance of the underlying index, and because of how cumulative returns work. If one share of the ETF costs $100 at the beginning of the period and the market dropped 5%, we should expect double the drop. Our share would now be worth $90. If the next day it reverses and goes up 5%, we should expect double the increase. We would be right in doing so, but our share would be worth $99 now, not $100—because it increased 10% above the $90 closing price the day before.
Leveraged ETFs Are for Traders, Not Investors
In general, no one can predict where an ETF will end up because it’s impossible to tell in advance what pattern the underlying index will follow. In practice, it means that an ETF only partially tracks the underlying index; its performance also depends on its own past results.
The ideal case for investing in an ETF (we assume it’s long the market) would be to buy it at the beginning of a multi-day, uninterrupted uptrend. In that case, it would come very close to doubling the market’s performance. But such winning streaks are impossible to forecast, and short-term trading like this is not our focus.
We don’t recommend leveraged ETFs in our portfolio because they’re geared for traders, and we take a longer-term perspective. We are investors.
The additional potential reward from a turbocharged ETF doesn’t warrant the additional risk, particularly when you’re investing retirement money. There are safer ways to maximize your retirement income. Learn more about our strategies for doing just that by signing up for Miller’s Money Weekly, our free weekly e-letter that educates conservative investors about timely investment strategies. You’ll receive ahead-of-the-curve financial insight and commentary right in your inbox every Thursday. Start building a rich retirement by signing up today.
The article Stop Investing in Leveraged ETFs was originally published at Millers Money
Make sure to check out our "Beginners Guide to Trading Options"....Just Click Here!
Tuesday, July 1, 2014
5 Simple Rules to Evolve Past the Hot Stock List
By Andrey Dashkov
If you’re a typical small time investor, chances are you prefer to let a team of analysts fuss about such irksome things as correlation and beta. Maybe you’ve bought a stock because your brother in law gave you a hot tip, maybe you heard something about it on a financial news show, or maybe you just loved the company’s product.Friends often ask me for “hot stock tips”—which is like walking up to someone at the craps table and asking what number to bet on. An accomplished craps player will have position limits, stop losses, income targets, and an overall strategy that does not hinge on one roll of the dice. You need an overall strategy long before you put money down.
So, what do I tell those friends asking for hot stock tips? Well, that they can retire rich with a 50-20-30 portfolio:
- Stocks. 50% in solid, diversified stocks providing healthy dividends and appreciation.
- High Yield. 20% in high yield, dividend paying investments coupled with appropriate safety measures. These holdings are bought for yield; any appreciation is a nice bonus.
- Stable Income. 30% in conservative, stable income vehicles.
The Art of the Pick
By the time an investment lands in our portfolio, we’ve already run it through our Five Point Balancing Test. When your boasting brother in law tempts you with a “can’t-miss opportunity” or some pundit touts a hot tech company on television, you can come back to these five points, again and again.
- Is it a solid company or investment vehicle? Investing your retirement money safely is a must. How do you know if a company is solid? Take the time to validate essential company information, particularly when the recommendation comes from a source with questionable motivation.
- Does it provide good income? A good stock combines a robust dividend and appreciation potential.
- Is there a good chance for appreciation? There are two types of appreciating stocks: those that rise because of general market conditions and those that rise further because of the way management runs the business. We want both.
- Does it protect against inflation? High inflation is one of the biggest enemies of a retirement portfolio.
- Is it easily reversible? Ask yourself, “Can I quickly and easily reverse this investment if something unexpected occurs?” The ability to liquidate inexpensively is critical to correcting errors.
Marking the Bull’s Eye So You Can Hit It
It’s worthwhile to write down your goal—including an income target and the price at which you’ll sell if things head south—with every investment. After all, if you can’t see the bull’s eye, how will you know if you’ve hit it? Buying any investment because a trusted adviser, newsletter, or pundit recommended it is not a good enough reason. Buying because your portfolio has a hole, you understand the company, the investment vehicle, the risks, and the potential is.
Remember, retiring rich means having enough money to enjoy your lifestyle without money worries. Do your homework on every investment and you’ll make that pleasant thought your life’s reality. Every week, the Miller’s Money team provides no nonsense, practical advice about the best ways to invest for your retirement in Miller’s Money Weekly Sign up here to receive it every Thursday.
The article 5 Simple Rules to Evolve Past the Hot-Stock List was originally published at Millers Money
Get your seat for our next free webinar "Low VIX and What It Means to Your Trading"....Just Click Here!
Wednesday, May 7, 2014
Is it Time to Admit That Gold Peaked in 2011?
By Jeff Clark, Senior Precious Metals Analyst
Have you seen this “real price of gold” chart that’s been making waves? Among other things, it purports to show the gold price adjusted for inflation over the past 223 years. Notice the 1980 vs. 2011 levels.
The chart makes it seem that on an inflation-adjusted basis, gold has matched its 1980 peak in 2011, or nearly so. A mainstream analyst who still thinks of gold as a “barbarous relic,” a government official who doesn’t want people to think of gold as money, or an Internet blogger looking for some attention might try to convince you that this proves that the gold bull market is over, arguing that the 2011 peak of $1,921 is the equivalent of the 1970s mania peak of $850 in January of 1980.
The logic is flawed, however; even if it were true that gold has matched its 1980 peak in inflation-adjusted prices, it would not prove that the top is in this time. This is not the 1970s, the global economy is under very different pressures, and there’s no rational basis at all for saying the top this time has to be at the same or similar level as last time.
That’s even if it were true that gold has matched its 1980 peak—but it hasn’t.
Inflation-Adjusted Gold Has NOT Matched Its 1980 Peak
First, if you go by official U.S. Bureau of Labor Statistic numbers, $850 in 1980 is equivalent to $2,320 in 2011, when gold hit its peak thus far in the current cycle. (It’s $2,403 in 2013 dollars, as is said to be used in the chart.)
We don’t know what data the authors of the chart used, nor their inflation adjustment method, so it’s hard to say what the problem is, but at the very least, we can say the chart is very misleading.
But there’s more. As you probably know, the government has made numerous changes to the way it calculates inflation—the Consumer Price Index (CPI)—since 1980. So, even the BLS number we’ve given grossly underestimates the real difference between the 2011 and 1980 peaks.
For a more apples to apples comparison, we should adjust for inflation using the government’s 1980 formula. And for that, whom better to ask than John Williams of Shadow Government Statistics (AKA Shadow Stats), the world’s leading expert on phony US government statistics?
I asked John to apply the CPI formula from January 1980 to the $1,921 gold price in 2011, to give us a more accurate inflation adjusted picture. Here’s what his data show.

Using the 1980 formula, the monthly average price of gold for January 1980 would be the equivalent of $8,598.80 today. The actual peak—$850 on January 21, 1980—isn’t shown in the chart, but it would equate to a whopping $10,823.70 today.
The Shadow Stats chart paints a completely different picture than the first chart. The current CPI formula grossly dilutes just how much inflation has occurred over the past 34 years. It’s so misleading that investment decisions based on it—like whether to buy or sell gold—could wreak havoc on a portfolio.
This could easily be the end of the discussion, but there are many more reasons to believe that the gold price has not peaked for the current bull cycle…...
Percentage Rise Has Been Much Smaller
Inflation adjusted numbers are not the only measure that matters. The percentage climb during the 1970s bull market was dramatically greater than what we experienced from 2001 to 2011. Here’s a comparison of the percentage gain during both periods.

From the 1970 low to the January 1980 peak, gold rose 2,346%. It climbed only 535% from the 2001 low to the September 2011 high—nowhere near mimicking that prior bull market.
Silver Scantly Participated in the 2011 Run-Up
After 31 years of trading, silver has yet to even reach its nominal price from 1980. It surged to $48.70 in 2011—but it hit $50 in January 1980.
On an inflation-adjusted basis, using the same data from John Williams, silver would need to hit $568 to match its 1980 equivalent.
The fact that silver has lagged this much—when its greater volatility would normally move its price by a greater percentage than gold—further shows that 2011 was not the equivalent of 1980.
No Bubble Characteristics in 2011
I’ll get some arguments from the mainstream on this one. “Of course gold was in a bubble in 2011—look at the chart!”
Yes, gold had a nice run-up that year. It rose 38.6% from January 1 to the September 6 peak. Anyone holding gold at that time was very happy. But that’s not a bubble. One of the major characteristics of a bubble is that prices go parabolic.
And that’s exactly what we saw in 1979-1980:
- In the 12 months leading up to its January 21, 1980 peak, gold surged an incredible 270%.
- In contrast, the year leading up to the September 6, 2011 peak, the price climbed 48%—very nice, but hardly parabolic, and less than a fifth of the 1970s runaway move.
No Global Phenomenon in 1980 (Next Time It Will Be)
In the 1970s, the “mania” was mostly a North American phenomenon. China and most of Asia didn’t participate. When inflation grips the world from all the money printing governments almost everywhere have engaged in, there will be a much greater demand for gold than in 1980.
When that day comes, there will be severe consequences for those who don’t have enough bullion. Not only will the price relentlessly move higher, but finding physical gold to buy may become very difficult.
Comparable Price Moves? So What?
The argument we started with is really the clincher. It doesn’t matter how today’s gold prices compare to those from prior bull markets; what matters are the factors likely to impact the price today. Are there reasons to own gold in the current environment—or not?
First, a comparison: Apple shares surged 112% in 2007. After such a run up, surely investors should’ve dumped it, right? Well, those who did likely regretted it, since it ended that year at $180 and trades over $590 today. In fact, even though it had already risen dramatically and in spite of it crashing with the market in 2008, there were plenty of solid reasons to buy the stock then, not the least of which was the introduction of the iPhone that year.
So should we sell gold because it rose 535% in a decade? As with the Apple example above, that’s not the right question.
There are, in fact, several more relevant questions for gold today:
- What will happen with the unprecedented amount of money that’s been printed around the world since 2008?
- Why are economies still sluggish after the biggest monetary experiment in history?
- Global debt and “unfunded mandates” are at never-before-seen levels; how can this conceivably be paid off?
- Interest rates are at historically low levels—what happens when they start to rise?
- Regardless of your political affiliation, do you trust that government leaders have the ability and willingness to do what’s necessary to restore the economy to health?
Today’s volatile world is exactly the kind of circumstance gold is best for.
The message here is clear, my friends. Regardless of the measure, gold has not matched its 1980 peak. And the reasons to own it have not faded. Indeed, they have grown. Continue to accumulate.
Learn about the best ways to invest in gold—how and when to buy it, where to store it for maximum safety, and how to find the best gold stocks—in the free 2014 Gold Investor’s Guide.
The article Time to Admit That Gold Peaked in 2011? was originally published at Casey Research
Check out our Advanced Study on Trading the Opening Gap in Crude Oil CL
Friday, April 25, 2014
Not All Debt Is Created Equal
By Dennis Miller
Optimal diversification: We all want it. Diversification is, after all, the holy grail of portfolio management. Our senior research analyst Andrey Dashkov has said that many times before, and he echoes that refrain in his editorial guest spot below.A brief note before I hand over the reins to Andrey. The last time the market tanked, many of my friends suffered huge losses. They all thought their portfolios were well diversified. Many held several mutual funds and thought their plans were foolproof. Sad to say, those funds dropped in tandem with the rapidly falling market. Our readers need not suffer a similar fate.
Enter Andrey, who’s here to explain what optimal diversification is and to share concrete tools for implementing it in your own portfolio.
Take it away, Andrey…
Floating-Rate Funds Bolster Diversification
By Andrey DashkovFloating rate funds as an investment class are a good diversifier for a portfolio that includes stocks, bonds, and other types of investments. Here’s a bit of data to back that claim.
The chart below shows the correlation of floating rate benchmark to various subsets of the debt universe.
As a reminder, correlation is a measure of how two assets move in relation to each other. This relationship is usually measured by a correlation coefficient that ranges from -1 to +1. A coefficient of +1 says the two securities or asset types move in lockstep. A coefficient of -1 means they move in opposite directions. When one goes up, the other goes down. A correlation coefficient of 0 means they aren’t related at all and move independently.
Why Correlation Matters
Correlation matters because it helps to diversify your portfolio. If all securities in a portfolio are perfectly correlated and move in the same direction, we are, strictly speaking, screwed or elated. They’ll all move up or down together. When they win, they win big; and when they fall, they fall spectacularly. The risk is enormous.
Our goal is to create a portfolio where securities are not totally correlated. If one goes up or down, the others won’t do the same thing. This helps keep the whole portfolio afloat.
As Dennis mentioned, diversification is the holy grail of portfolio management. We based our Bulletproof strategy on it precisely because it provides safety under any economic scenario. If inflation hits, some stocks will go up, while others will go down or not react at all.
You want to hold stocks that behave differently. Our mantra is to avoid catastrophic losses in any investment under any scenario, and the Bulletproof strategy optimizes our odds of doing just that.
When “Weak” is Preferable
Now, a correlation coefficient may be calculated between stocks or whole investment classes. Stocks, various types of bonds, commodities—they all move in some relationship to one another. The relationship may be positive, negative, strong, weak, or nonexistent. To diversify successfully and make our portfolio robust, we need weak relationships. They make it more likely that if one group of investments moves, the others won’t, thereby keeping our whole portfolio afloat.
Now, back to our chart. It shows the correlation between investment types in relation to floating-rate funds of the sort we introduced into the Money Forever portfolio in January. For corporate high yield debt, for example, the correlation is +0.74. This means that in the past there was a strong likelihood that when the corporate high yield sector moved up or down, the floating rate sector moved in the same direction. You have to remember that correlation describes past events and can change over time. However, it’s a useful tool to look at how closely related investment types are.

I want to make three points with this chart:
- Floating-rate loans are closely connected to high-yield bonds. The debt itself is similar in nature: credit ratings of the companies issuing high-yield notes or borrowing at floating rates are close; both are risky (although floating-rate debt is less so, and recoveries in case of a default are higher).
Floating-rate funds as an investment class are not as good a diversifier for a high-yield portfolio. They can, on the other hand, provide protection against rising interest rates. When they go up, the price of floating-rate instruments remains the same, while traditional debt instruments lose value to make up for the increase in yield.
- Notice that the correlation to the stock market is +0.44. If history is a guide, a falling market will have less effect on our floating-rate investment fund.
- The chart shows that floating-rate funds serve as an excellent diversifier for a portfolio that’s reasonably mixed and represents the overall US aggregate bond market. The correlation is close to zero: -0.03. This means that movements of the overall US bond market do not coincide with the movements of the floating rate universe.
Imagine two people walking down a street, when one (the overall debt market) turns left, the other (floating rate funds) would stop, grab a quick pizza, get a message from his friend, catch a cab, and drive away. No relationship at all… at least, not in the observed time period. This is the diversification we’re looking for.
Our Bulletproof income portfolio offers a number of options for diversification above and beyond what’s mentioned here. You can learn all about our Bulletproof Income – and the other reasons it’s such an important one for seniors and savers – here.
The article Not All Debt Is Created Equal was originally published at Millers Money
Don't miss this weeks great webinar with John Carter. “How HFT firms are causing you to lose money trading”. Click Here to Reserve Your Seat Now!
Don't miss this weeks great webinar with John Carter. “How HFT firms are causing you to lose money trading”. Click Here to Reserve Your Seat Now!
Tuesday, April 8, 2014
ETF Trading Newsletter - CORN ALERT
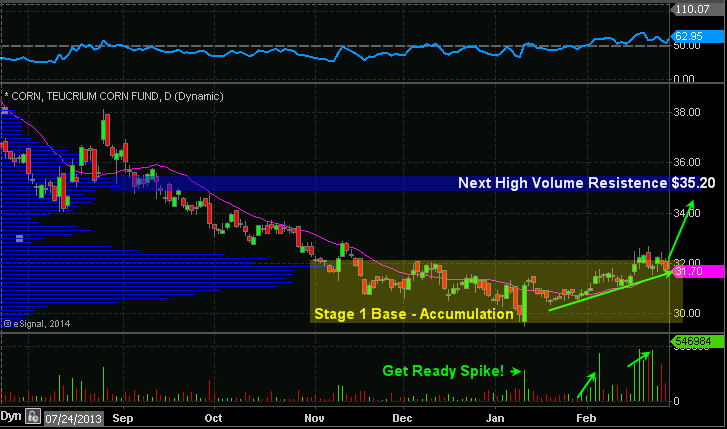
We have been watching the commodities index rally for a few weeks now with natural gas, coffee, sugar, gold, silver and several others jump in price. We have been watching the corn ETF "CORN" which is a basket of several commodities to get a feel for the commodities market as a whole.
While most of the commodities have posted some solid gains, corn has yet to pop in price. Corn looks to be forming a stage 1 basing pattern and the volume/money flowing into this fund suggest new money is moving into corn because it looks as though it will be the last to pop and rally in price.
This is similar to how we entered the silver trade a few weeks back. Everything else in the precious metals sector popped and silver lagged giving us a high probability setup.
Both the short and long term the charts of corn look bullish. As usual I will lock in some gains if we get a pop in the commodity, then let the balance ride with a break even stop. If corn is entering a new bull market phase (Stage 2) I want to hold some long term. There is potential for a 19%-30% rise in value.
Corn Trade Information:
Buy corn ETF "CORN", Stop $29.90, Downside Risk 6%, Portfolio Size 6%

Consider joining my group of happy traders today at: The Gold & Oil Guy
Chris Vermeulen
Sign up for one of our Free Trading Webinars....Just Click Here!
While most of the commodities have posted some solid gains, corn has yet to pop in price. Corn looks to be forming a stage 1 basing pattern and the volume/money flowing into this fund suggest new money is moving into corn because it looks as though it will be the last to pop and rally in price.
This is similar to how we entered the silver trade a few weeks back. Everything else in the precious metals sector popped and silver lagged giving us a high probability setup.
Both the short and long term the charts of corn look bullish. As usual I will lock in some gains if we get a pop in the commodity, then let the balance ride with a break even stop. If corn is entering a new bull market phase (Stage 2) I want to hold some long term. There is potential for a 19%-30% rise in value.
Corn Trade Information:
Buy corn ETF "CORN", Stop $29.90, Downside Risk 6%, Portfolio Size 6%
Consider joining my group of happy traders today at: The Gold & Oil Guy
Chris Vermeulen
Sign up for one of our Free Trading Webinars....Just Click Here!
Thursday, April 3, 2014
What Is Worse Than Being at Risk?

By Dennis Miller
You may have heard the old adage: “What is worse than being lost? Not knowing you are lost.” In that same vein: What is worse than being at risk? You guessed it! Not knowing you’re at risk. For many investors, portfolio diversification is just that. They think they are protected, only to find out later just how at risk they were.Diversification is the holy grail of portfolio safety.
Many investors think they are diversified in every which way. They believe they are as protected as is reasonably possible. You may even count yourself among that group. If, however, you answer “yes” to any of the following questions, or if you are just getting started, I urge you to read on.
- Did your portfolio take a huge hit in the 2008 downturn?
- Was your portfolio streaking to new highs until the metals prices came down a couple years ago?
- Do oil price fluctuations have a major impact on your portfolio?
- When interest rates tanked in the fall of 2008, did a major portion of your bonds and CDs get called in?
- Are you nervous before each meeting of the Federal Reserve, wondering how much your portfolio will fluctuate depending on what they say?
- Has your portfolio grown but your buying power been reduced by inflation?
- Do you still have a tax loss carry forward from a stock you sold more than three years ago?
The old saying rings true here: “When the student is ready to learn, the teacher shall appear.” Sad to say, for many investors that happens after they have taken a huge hit and are trying to figure out how to prevent another one.
Alas, there is an easier way. Anyone who has tried to build and manage a nest egg will agree it is a long and tedious learning experience. The key is to get educated without losing too much money in the meantime.
Avoid Catastrophic Losses
The goal of diversification is to avoid catastrophic losses. In the past, we’ve mentioned correlation and shared an index related to our portfolio addition. The scale ranges from +1 to -1. If two things move in lockstep, their correlation rates a +1. If the price of oil goes up, as a general rule the price of oil stocks will also rise.If the two things move in the opposite direction (a correlation of -1), we can also predict the results. If interest rates rise, long term bond prices will fall and generally so will the stocks of homebuilders. At the same time, a correlation of zero means there is no determinable relationship. If the price of high grade uranium goes up, more than likely it will not affect the market price of Coca Cola, ticker $KO, stock. So, your goal should be to minimize the net correlation of your portfolio so no single event can negatively impact it catastrophically.
General Market Trends
An investor with mutual funds invested in Large Cap, Mid Cap, and Small Cap stocks may think he is well diversified with investments in over 1,000 different companies. Ask anyone who owned a stable of stock mutual funds when the market tumbled in 2008 and they will tell you they learned a lesson.Mr. Market is not known to be totally rational and many have lost money due to “guilt by association.” When the overall stock or bond market starts to fall, even the best managed businesses are not immune to some fallout. While the Federal Reserve has pumped trillions of dollars into the system, there is no guarantee the market will rebound as quickly as it has in the last five years. The market tanked during the Great Depression and it took 25 years to return to its previous high.
If you listen to champions of the Austrian business cycle theory, they will tell you the longer the artificial boom, the longer and more painful the eventual bust. Mr. Market can dish out some cruel punishment.
Diversification is indeed the holy grail, but there are some risks which diversification cannot mitigate entirely. No matter how hard you try to fortify your bunker, sooner or later we will learn of a bunker buster. There are times when minimizing the damage and avoiding the catastrophic loss is all anyone can do.
Sectors
Allocating too much of your portfolio to one sector can be dangerous. This is particularly true if a single event can happen that could give you little time to react. While no one predicted the events of September 11, people who held a lot of airline stocks took some tough losses. Guilt by association also applied here. After September 11, the stocks of the best-managed airlines, hotels, and theme parks took a downturn.When the tech bubble and real estate bubble burst, the stock prices of the best-run companies dropped along with the rest of the sector, leaving investors to hope their prices would rebound quickly.
Geography
One of the major factors to consider when investing in mining and oil stocks is where they are located. It is impossible to move a gold mine or an oil well that has been drilled. Many governments are now imposing draconian taxes on these companies, which negatively impacts shareholders. In some cases, this can be a correlation of -1. If an aggressive government is affecting a particular oil company, other companies in different locations may have to pick up the slack and their stock may rise in anticipation of increased sales.Many governments around the world have become very aggressive with environmental regulation, costing the industry billions of dollars to comply. If you want to invest in companies that burn or sell anything to do with fossil fuels, you would do well to understand the political climate where their production takes place.
Investors who prefer municipal bonds must make their own geographical rating on top of the ratings provided for the various services. States like Michigan and Illinois are headed for some rough times. I wouldn’t be lending any of them my money in the current environment no matter what the interest rate might be.
Currency Issues
Inflation is public enemy number one for seniors and savers. One of the advantages of currencies is they always trade in pairs. If one currency goes up, another goes down. If the majority of your portfolio is in one currency, you are well served to have investments in metals and other vehicles good for mitigating inflation.Tim Price sums it up this way in an article posted on Sovereign Man:
“Why do we continue to keep the faith with gold (and silver)? We can encapsulate the argument in one statistic.
“Last year, the US Federal Reserve enjoyed its 100th anniversary. … By 2007, the Fed’s balance sheet had grown to $800 billion. Under its current QE program (which may or may not get tapered according to the Fed’s current intentions), the Fed is printing $1 trillion a year. To put it another way, the Fed is printing roughly 100 years’ worth of money every 12 months. (Now that’s inflation.)”
It is difficult to determine when the rest of the world will lose faith in the U.S. dollar. Once one major country starts aggressively unloading our dollars, the direction and speed of the tide could turn quickly.Interest-Rate Risk
The Federal Reserve plays a major role in determining interest rates. Basically they have instituted their version of price controls and artificially held interest rates down for over five years. Interest-rate movement affects many markets: housing, capital goods, and some aspects of the bond markets. While it also makes it easier for businesses to borrow money, they are not likely to make major capital expenditures when they are uncertain about the direction of the economy.While holders of long term, high interest bonds had an unexpected gain when the government dropped rates, their run will eventually come to an end as rates rise. Duration is an excellent tool for evaluating changes in interest rates and their effect on bond resale prices and bond funds. (See our free special report Bond Basics, for more on duration.)
While interest rates have been rising, when you factor in duration there is significant risk, even with the higher interest offered for 10- to 30-year maturities. Again, having a diversified portfolio with much shorter term bonds helps to mitigate some of the risk.
Risk Categories of Individual Investments
While investors have been looking for better yield, there has been a major shift toward lower-rated (junk) bonds. Many pundits have pointed out that their default rate is “not that bad.”At the same time, the lure of highly speculative investments in mining, metals, and start-up companies with good write-ups can be very appealing. There is merit to having small positions in both lower-rated bonds and speculative stocks because they offer terrific potential for nice gains.
So What Can Income Investors Do?
There are a number of solid investments out there that offer good return, with a minimal amount of risk exposure and that won’t move because of an arbitrary statement by the Fed. It’s not always easy to find them, but there is hope for people wondering what to do now that all of the old adages about retirement investing are no longer true.There are three important facets of a strong portfolio: income, opportunities and safety measures. Miller's Money Forever helps guide you through the better points of finance, and helps replace that income lost in our zero-interest-rate world—with minimal risk.
This is where the value of one of the best analyst teams in the world comes into focus. We focus on our subscribers’ income-investing needs, and I challenge our analysts to find safe, decent-yielding, fixed-income products that will not trade in tandem with the steroid-induced stock market—or alternatively, ones that will come back to life quickly if they do get knocked down with the market. They recently showed me seven different types of investments that met my criteria and still withstood our Five Point Balancing Test.
My peers are of having holes blown in their retirement plans. While nuclear bomb shelter safe may be impossible, we still want a bulletproof plan. This is what we’ve done at Money Forever: built a bulletproof, income generating portfolio that will stand up to almost anything the market can throw at it.
It is time to evolve and learn about the vast market of income investments safe enough for even the most risk-wary retirees. Some investors may want to shoot for the moon, but we spent the bulk of our adult lives building our nest eggs; it’s time to let them work for us and enjoy retirement stress free. Learn how to get in, now.
The article What Is Worse Than Being at Risk? was originally published at Millers Money
A Profits Pipeline Starts Here Right Here!
Sunday, March 16, 2014
What GM, GS and XOM Do, So Does the Broad Market

About 10 years ago I traded with a floor trader who swore that whatever GS (Goldman Sachs) did the market followed. Another said he only used XOM (Exxon Mobil), while Stan Weinstein says GM (General Motors) was the stock to follow.
While each of these traders have been highly successful with their bellwether stock, I wanted to cover these in more detail and show you have to get the best of each of their strategies working for you. This will help you properly time the market, identify the overall market health and at which point you should be getting long or short stocks in your portfolio.
Just Click Here to Watch this Quick Video
If you would like to successfully trade both bull and bear markets then join my trading and investing newsletter today and catch the next hot sectors for 2014 using my ETF Trading Strategies.
Chris Vermeulen
The Gold & Oil Guy
Get more of our "Gold and Crude Oil Trade Ideas"
Wednesday, March 12, 2014
Elliott Wave Theory - Keys to Investor Success

The reality is that no matter how many times you are told differently, there is no ‘magic bullet.’ There is no plan, no series of steps you can follow that will, with absolute certainty, bring you wealth. If you happen across anyone who says otherwise, you can rely on the fact that he or she has an agenda, and that at least part of that agenda involves convincing you to open your wallet.
In the place of a surefire way to make profits, what is there? Where can you turn, and what kinds of things should you be looking for?
The answers to those questions aren’t as glamorous sounding as the promises made by those who just want to take your money, but they are much more effective. Things like careful, meticulous research. Market trend analysis. Paying close attention to extrinsic factors that could impact whatever industry you’re planning to invest in, and of course, Elliott wave theory. If you’ve never heard of the Elliott wave, you owe it to yourself to learn more about it.
Postulated by Ralph Nelson Elliott in the late 1930’s, it is essentially a psychological approach to investing that identifies specific stimuli that large groups tend to respond to in the same way. By identifying these stimuli, it then becomes possible to predict which direction the market will likely move, and as he outlined in his book “The Wave Principle,” market prices tend to unfold in specific patterns or ‘waves.’
The fact that many of the most successful Wall Street investors and portfolio managers use this type of trend analysis in their own decision making process should be compelling evidence that you should consider doing the same. No, it’s not perfect, and it is certainly not a guarantee, but it provides a strong framework of probability that, when combined with other research and analysis, can lead to consistently good decisions, and at the end of the day, that’s what investing is all about. Consistently good decision making.
We use Elliott Wave Theory in real time by looking at the larger patterns of the SP 500 index for example. We deploy Fibonacci math analysis to prior up and down legs in the markets to determine where we are in an Elliott Wave pattern. This helps us decide if to be aggressive when the markets correct, go short the market, or to do nothing for example. It also prevents us from making panic type decisions, whether that be in chasing a hot stock too higher or selling something too low before a reversal. We also can use Elliott Wave Theory to help us determine when to be aggressive in selling or buying, on either side of a trade.
For many, its not practical to employ Elliott Wave analysis with individual stocks and trading, but it can be done with experience. We instead use a combination of big picture views like weekly charts, Wave patterns within those weekly views, and then zoom in to shorter term technical to determine ultimate timing for entry and exit. This type of big picture view coupled with micro analysis of the charts gives us more clarity and better results.
One of our favorite patterns for example is the “ABC” pattern. Partially taken from Elliott Wave Theory, we mix in a few of our own ingredients to help with timing entries and exits. This is where you have an initial massive rally or the “A” wave pattern. Say a stock like TSLA goes from $30 to $180 per share, which it did. The B wave is what you wait for and using Fibonacci analysis and Elliott Wave Theory we can calculate a good entry point on the B wave correction. TSLA dropped from $180 to about $ 120, retracing roughly 38% (Fibonacci retracement) of the rally $30 to $180. The B wave bottomed out as everyone was negative on the stock and sentiment was bearish. That is when you get long for the “C” wave. The C wave is when the stock regains momentum, good news starts to unfold, and sentiment turns bullish. We can often calculate the B wave as it relates often to the A wave amplitude. Example is the TSLA “A” wave was 150 points, so the C wave will be about the same or more.
When TSLA recently ran up to about $270 per share, we were in uber bullish “C” wave mode, and we had run up $150 (Same as the A wave) from $120 to $270. That is when you know it’s a good time to start peeling off shares. Often though, the C wave will be 150-161% of the A wave, so TSLA may not have completed it’s run just yet.

Knowing when to enter and exit a position whether your time frame is short, intermediate, or longer… can often be identified with good Elliott Wave Theory practices. Your results and your portfolio will appreciate it, just look at our ATP track record from April 1 2013 to March 3rd 2014 inclusive of all closed out swing positions. We incorporated Elliott Wave Theory into our stock picking starting last April and you can see the results:

Join Us Today And Start Making Real Money Trading - Click Here
Sincerely,
Chris Vermeulen
Founder of Technical Traders Ltd. - Partnership Program
Saturday, March 8, 2014
Maximizing Your IRA: An Interview with Terry Coxon
By Dennis Miller
As working folks get closer to hanging up their spurs, it is easy to become overwhelmed. When should you take Social Security? What type of insurance do you need? Should you buy an annuity? Do you need nursing home insurance? Should you roll over your 401(k) into an IRA? The list goes on and on.Retirement planning requires many irreversible decisions. We each need to get it right; however, what is right for us is not always right for someone else. And, in addition to basic number crunching, we each make assumptions about life and politics—sometimes without even realizing it.
One of my most significant personal decisions pertained to a Roth IRA. Managing your traditional or Roth IRA is an ongoing process, no matter how near or far you are from retirement. And the options are worth investigating regardless of the size of your portfolio. Making sure your money lasts requires much more than picking the right stocks. Owning those stocks—or whatever else you invest in—inside the right type of account can grow your portfolio faster and save you thousands of dollars in taxes, if not more.
I’m not shy about seeking out experts in different investment niches. In this spirit, I reached out to Terry Coxon, a senior economist and editor at Casey Research and principal in Passport IRA.
In the spirit of full disclosure, I want to add that Terry has taken the time to mentor me on occasion, and he’s encouraged me to bring some of my vast life experience to our readers. As Terry has reminded me from time to time, math is only part of the retirement puzzle—the uncertainties inherent to politics and the law are also integral pieces.
Terry travels the world, and I was lucky to catch him upon his return from a recent trip to the Cook Islands.
Dennis Miller: Terry, welcome. Many investors use a traditional IRA or retired with a lump sum from their 401(k). Can you tell us how a Roth IRA differs from those plans?
Terry Coxon: With a traditional IRA, if your income isn’t too high, you get a tax deduction for your annual contribution. But later, the money you withdraw is taxable as ordinary income, except to the extent of any non-deductible contributions you made. In the meantime, earnings accumulate without current tax, which helps the money grow much faster.
A Roth IRA is different. With a Roth IRA, you don’t get a tax deduction for your contributions; but all the withdrawals you later make can be tax free. The only requirements for keeping withdrawals 100% tax free are: (a) the Roth IRA must be in at least its fifth calendar year of existence; and (b) you must have reached the calendar year in which you will be at least 59 1/2 years old. As with a traditional IRA, earnings accumulate and compound free of current tax – which is the special power source of any retirement plan.
Most 401(k) accounts are similar to a traditional IRA in that contributions are deductible; withdrawals are taxable; and while they stay inside the account, earnings go untaxed. However, there is a variant called a Roth 401(k) that is available to sole proprietors and to participants in employer plans whose rules provide for Roths. With a Roth 401(k), there is no deduction for money that goes in; the money is invested free of current tax; and everything can be tax-free when it comes out.
Fleeing the High Tax Zone
Dennis: When I retired, I had a 401(k), and then rolled it over to a traditional IRA. As I began to understand the Roth IRA, I realized there were real benefits to putting my nest egg in a Roth. I had a CPA tell me not to do it, and he ran the numbers to show me why.
In April 2012, you published an article, Doing the Roth Arithmetic, which painted a much different picture. Can you explain all the factors and why they are so important?
Terry: Staying with a traditional plan or going to a Roth is a big decision, and it’s not always an easy or simple one. The decision needs to be based on the individual’s current circumstances, which are a matter of fact, and also on his hard-to-know future circumstances. Make the right decision, and you can come out way ahead. Let’s look at two extreme situations—which is helpful because extreme situations point to clear answers.
Situation #1 is the individual who has all of his investments in an IRA or other retirement plan, who is not in the top tax bracket, who expects that his tax rate is more likely to decline than to rise, and who expects to consume all of his assets in his own lifetime. That individual has nothing to gain by going the Roth route and might be walking into a higher tax bill if he takes it. If that description fits you, sit tight with your traditional IRA or 401(k).
Situation #2 is the individual with substantial investments outside of retirement plans, who is in or near the top tax bracket and expects to stay there, and who has more than he needs to live on for the rest of his life. That individual should definitely convert to a Roth. He’ll have to pay a big tax bill now rather than later, but he’ll get the better of the bargain. He will be buying out his minority partner—the government—that in any case will, sooner or later, collect 40% or so of his traditional IRA in taxes.
The money for the tax bill can and should come out of the individual’s non-IRA assets—which live in a high tax zone. That way, the net effect of converting to a Roth is to move capital from the high-tax zone (direct personal ownership) to the no-tax zone (the Roth).
You can get an added bonus by converting to a Roth IRA, and it’s a lot more valuable than a second ShamWow. A Roth IRA is not subject to the minimum withdrawal requirements that kick in at age 70 1/2 for someone with a traditional IRA. Escaping the minimum withdrawal requirements lets money stay in the no-tax zone longer, especially if you won’t need to spend it all in your own lifetime.
Don’t ask why, but unlike a Roth IRA, a Roth 401(k) is subject to minimum withdrawal requirements. However, you can convert a Roth 401(k) to a Roth IRA without tax cost.
Dennis: I have a friend who has a traditional IRA and is of the age where he has to take a required minimum distribution and pay taxes on the income. He is quite a bit older than his wife and would prefer to leave the money in the sheltered account. With a Roth IRA, are there any required withdrawal times or amounts?
Terry: Your friend is a good candidate for a Roth conversion. If he converts, he can stop making the withdrawals he doesn’t want to make. And once the Roth reaches its fifth calendar year, withdrawals he or his wife take will be tax-free. And if his wife doesn’t use it up, the Roth will be available for tax-free withdrawals by their children or other heirs.
Self-Directed and Open Opportunity IRAs
Dennis: A lot of folks think you have to have an IRA with a bank or brokerage company. Can you explain the concept behind self-directed Roth IRAs?
Terry: Quite a few people will be knocked over by the news, but the rules written by Congress allow an IRA to invest in almost anything (there are only a few, easy-to-live-with limitations). But when you go to a bank, broker, mutual fund family, or insurance company, you find that you can only invest in… their stuff. So go elsewhere.
“Self-directed” IRAs are available with a number of IRA custodians that specialize in opening doors to the full world of investment possibilities for IRA participants. They don’t promote any particular investments or investment products. Instead, they earn fees by doing the paperwork for pulling whatever investments you want under the umbrella of your IRA. It could be an apartment house or a farm or gold coins or private loans or tax liens or almost anything else. Rather than buying CDs from a bank, your IRA can be the bank.
It can be even better. A few custodians administer a special type of self-directed IRA called an “Open Opportunity” IRA. The idea is as powerful as it is simple. The IRA owns just one thing—a limited liability company that you manage. Since you are the manager, you have hands-on control, and you are free to buy almost any investment you think is right. You don’t need to wait for anyone’s permission or stamp of approval. The hands on the steering wheel are yours.
Dennis: What tips do you have for folks who want to roll their 401(k) over to a Roth? When should they start? Should they pay the taxes from the proceeds or other funds?
Terry: As I said earlier, the decision to convert isn’t simple. The best single indication that it is the right move is that you are able to pay the tax out of non-retirement-plan assets.
Dennis: I recently wrote an article about encore careers. If a retiree decides on a second career, can he start making contributions to his Roth?
Terry: Yes, no, and yes.
The first yes is: you are as eligible to contribute from your earnings from your encore career as you were during your earlier careers.
The no is: if your income is too high, you are not eligible to contribute to a Roth IRA.
The second yes is: Anyone can convert a traditional IRA to a Roth IRA. There are no income limitations. So you can always get to a Roth by contributing to a traditional IRA and then converting. The required waiting period is less than 15 nanoseconds.
Internationalizing Your IRA
Dennis: I’ve recently spoken with Nick Giambruno, senior editor of International Man, about international diversification. Can you help us understand our international options if we have money in a Roth?
Terry: This is one more wonderful thing about the Open Opportunity IRA structure. The LLC that lives inside the IRA can invest anywhere in the world. Want a brokerage account in Singapore? The IRA’s LLC can be the account holder. Want a farm? The LLC can buy it in New Zealand. Want gold? The LLC can keep it in a safe deposit box in Austria. Want your IRA to go into the ski rental business? The IRA’s LLC can open a shop in Chile. And the IRA’s LLC can own—or be—a foreign LLC.
Dennis: I have a good portion of my Roth offshore, but it is not inside an LLC. It is invested in traditional investments—stocks, bonds, etc., except on a worldwide basis and in a variety of foreign currencies. Are there times when an LLC might not be necessary?
Terry: Whatever you want your IRA to buy and wherever you want the investments to reside, doing everything through your IRA’s wholly owned LLC is quicker, easier, and cheaper. With the LLC in place, you don’t need to keeping going back to the IRA custodian for every transaction. You avoid fees and you avoid delays. You are in the driver’s seat.
Using a foreign LLC to hold foreign investments may give you two additional advantages. First, some foreign institutions are more willing to deal with a non-US LLC owned by a US person than they are to deal directly with a US person. Second, if the US government ever imposes currency controls or capital controls or undertakes a program of forced gold sales, an IRA’s foreign LLC—depending on the specifics of the new rules—might go untouched.
Dennis: Terry, I want to thank you on behalf of our readers. You have opened up avenues for real tax savings and additional safety.
Terry: People work hard, and it is tough for some to save money. Understanding their Roth IRA options is a good way for people to keep it and make it last. Enjoyed it, Dennis—glad I could help.
Final Thoughts from Dennis
With a traditional IRA, you get a tax deduction when you make your contribution, and that money grows tax-free. When you take it back out, it is subject to taxation.
A Roth works in the opposite manner. There is no tax deduction when you make the contribution, but it also grows tax-free. The difference is that when you take it out, there is no tax as long as you follow a few basic rules, which Terry discussed.
I am a strong advocate of maximizing your 401(k), particularly if your employer matches all or part of your contributions. Save as much money as you possibly can during your working career. At the same time, there are many reasons why, as Terry suggested, you might want buy out your business partner (the government) so you can grow your nest egg tax-free and make tax-free withdrawals as you see fit.
As you’ve just read, as the editor of Miller's Money Forever, I often have the pleasure of interviewing my colleagues on a variety of topics to give our subscribers even greater exposure to different investing sectors. Recent interviews include:
- Energy Profits with Marin Katusa, senior economist and editor at Casey Research;
- The Ultimate Layer of Financial Protection with Nick Giambruno, editor of International Man;
- Juniors for Seniors with Louis James, globe-trotting senior editor of Casey Research's metals and mining publications; and
- Other esteemed colleagues.
The article Maximizing Your IRA: An Interview with Terry Coxon was originally published at Millers Money.
Make sure you don't miss "What 10-Baggers [and 100-baggers] Look Like"
Thursday, March 6, 2014
How Much Will a 15% Hair Cut Cost Your Investment Capital?
Over the past few weeks I have been watching the DOW and Transportation index closely because it looks and feels like the Dow Theory may play out this year and the stock market could take a 15% haircut.
But what if you skipped on the haircut and opted for a 40% refund? What? Keep reading to find out how.
Keeping this post short and sweet, I think the U.S. stock market is setting up for a sharp selloff. And it will look a lot like the July 2011 correction. If my calculations are correct this will happen in the next 3-9 weeks and we will see a 15% drop from our current levels. Only time will tell, but I have a way to hedge against this with very little downside risk to you ETF portfolio.
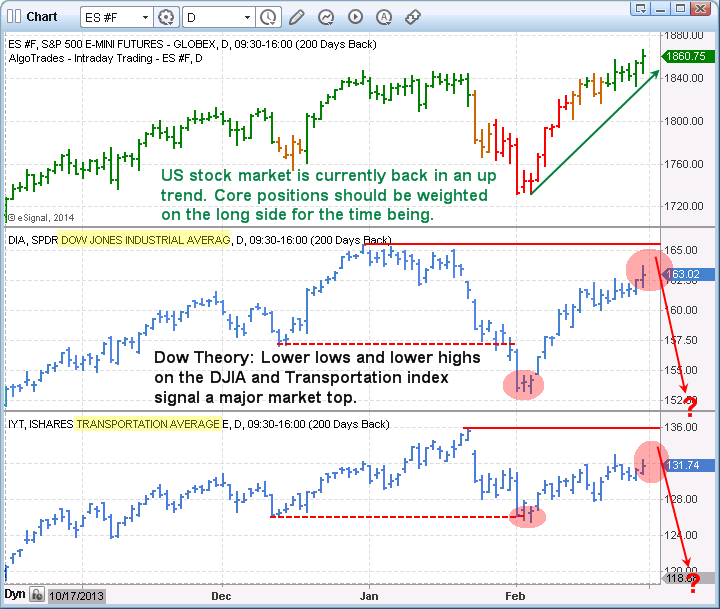
The Dow Theory could be in play. When both the Transports (IYT) and the Dow Jones Industrial Average (DIA) cannot make higher highs and start making lower lows, according to the Dow Theory the broad stock market is topping.
We are watching the market closely because they have both made lower highs and lows. This rally could stall in the next couple weeks and if so we expect a 15% correction.

Take a look at the 2011 Stock Market Crash

The chart above shows how fearful traders have a delayed reaction to moving money from stocks to a mix of risk-off assets.
The choppy market condition during August and September clearly helped in frustrating investors and created more uncertainty. This helped prices of this ETF portfolio fund rally long after the initial selloff took place. This is something I feel will take place again in the near future and subscribers of my ETF newsletter will benefit from this move.
Because we have a Dow Theory setup, our risk levels are clearly defined as to when to exit the trade if it does not play out in our favor. But with the potential to make 40% and the downside risk only being 4%, it’s the perfect setup for a large portion of our ETF portfolio. And just so you know this is not a precious metals trade as we are already long that sector and up 10% in that position already.
Chris Vermeulen
The Gold & Oil Guy.com
But what if you skipped on the haircut and opted for a 40% refund? What? Keep reading to find out how.
Keeping this post short and sweet, I think the U.S. stock market is setting up for a sharp selloff. And it will look a lot like the July 2011 correction. If my calculations are correct this will happen in the next 3-9 weeks and we will see a 15% drop from our current levels. Only time will tell, but I have a way to hedge against this with very little downside risk to you ETF portfolio.
The Dow Theory Live Example for ETF Portfolio
The daily chart of the SP500 index below shows our current trend analysis with green bars signaling an uptrend, orange being neutral, and red signaling bearish price action. Currently the bars are green and we can expect prices to have an upward bias.The Dow Theory could be in play. When both the Transports (IYT) and the Dow Jones Industrial Average (DIA) cannot make higher highs and start making lower lows, according to the Dow Theory the broad stock market is topping.
We are watching the market closely because they have both made lower highs and lows. This rally could stall in the next couple weeks and if so we expect a 15% correction.
Take a look at the 2011 Stock Market Crash
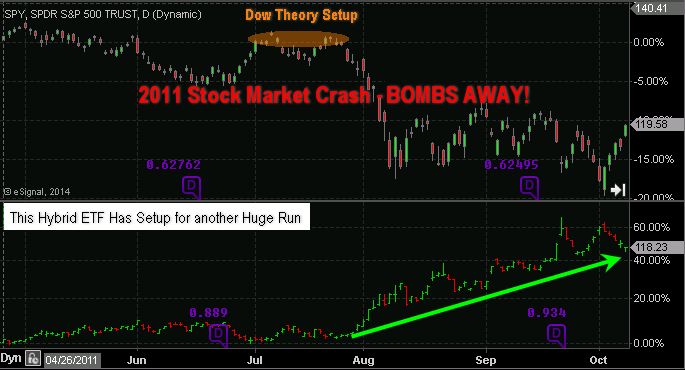
The chart above shows how fearful traders have a delayed reaction to moving money from stocks to a mix of risk-off assets.
The choppy market condition during August and September clearly helped in frustrating investors and created more uncertainty. This helped prices of this ETF portfolio fund rally long after the initial selloff took place. This is something I feel will take place again in the near future and subscribers of my ETF newsletter will benefit from this move.
Because we have a Dow Theory setup, our risk levels are clearly defined as to when to exit the trade if it does not play out in our favor. But with the potential to make 40% and the downside risk only being 4%, it’s the perfect setup for a large portion of our ETF portfolio. And just so you know this is not a precious metals trade as we are already long that sector and up 10% in that position already.
Get My Daily Video Forecasts & ETF Trades Today
Chris Vermeulen
The Gold & Oil Guy.com
Tuesday, February 25, 2014
Appetite for Distraction

By Grant Williams
It was during the siege of Fort Sumter that the story I want to share with you takes place….
This story came to me from the pen of Jared Dillian, the very talented writer of an excellent publication called The Daily Dirtnap; and the moment I read it I knew I had to share it with my readers, because it illustrates perfectly something I have been talking to people about for years.
Readers can, and definitely should check out Jared's fantastic work HERE; and to give you a taste of Jared's enviable narrative prowess, I am going to let him tell you the story as he told it to me:
The Calhoun Mansion
Let me tell you again why I like gold and silver.
I was in Charleston two weekends ago for my mom's birthday. We did a horse and carriage ride, a historical tour, around the city. I always thought those things were cheesy, but as it turns out, the horse and carriage tours are very highly regulated, the tour guides have to pass a series of knowledge exams and then take continuing education. I kid you not! Ours had been doing it for six years, and was good.

So as we went by the Calhoun Mansion on Meeting Street, the tour guide fella starts telling us about the house. It was built by a guy named George Walton Williams, who was the richest guy in town. This was back during the Civil War. It's a 24,000 square foot mansion with 14 foot ceilings. It's just monstrous. It cost $200,000 to build — back in the 1860s! So how did Mr. George Walton Williams make his money?
Well, as you probably know, Charleston is a port city, and during the War, the Union Navy blockaded the port and then bombarded the city for weeks and months, but during this time, there were these guys who were "blockade runners" who would sneak by the navy ships, bringing necessary supplies to the city, which was under siege. Blockade runners made a lot of money — five grand a trip sometimes — but you know who made even more money? George Walton Williams did.
He financed the blockade runners.
Williams was not the only one doing this, but he was the most successful, why? Because he insisted on being paid only in gold and silver. If you know your Civil War history you also know that there was a Confederate currency, and I don't know if Mr. Williams had a particular view on the Confederate dollar, but at the conclusion of the war, the Confederate dollar collapsed, and everyone was left holding the bag — except for George Walton Williams.
Williams became like a J.P. Morgan character in the city — Charleston was the center of Southern finance, and Williams singlehandedly bailed out the Broad Street banks. He also built a pretty cool house.
This next paragraph contains the fundamental principle of investing in gold and silver, which so few people genuinely understand — despite the multitudes of commentators expending countless thousands of words.
Hit 'em between the eyes, Jared:
So these anti gold idiots are just that, idiots, or else they have the memory of a goldfish, because currencies come and currencies go, as sure as night follows day. It is the natural order of things. And as you can see, it's not about trading gold to get rich or getting long gold or buying one by two call spreads or getting fancy, it literally is about protecting yourself in the end. It's not like Williams got rich. He just stayed rich. Everyone else got poor.
That's it. Right there.
Thanks, Jared, I'll take it from here.
Click here to continue reading this article from Things That Make You Go Hmmm… – a free weekly newsletter by Grant Williams, a highly respected financial expert and current portfolio and strategy advisor at Vulpes Investment Management in Singapore.
The article Things That Make You Go Hmmm: Appetite for Distraction was originally published here at Mauldin Economics
Don't Miss This Weeks Free Trading Webinar...."Making the "Big Trades"
Thursday, November 14, 2013
Exxon Mobil - The Surprising Big Chart Picture
While our trading partner Adam Hewsion was reviewing his energy portfolio this morning, he stopped and looked at the chart for Exxon Mobile (NYSE:XOM). He immediately noticed major resistance coming in at the $95 level. Can Exxon break through this major resistance level and take off to the upside?
He measured from the resistance at $95 all the way down to the low in July of 2010, the difference is around $35. If he then added $35 to the breakout point, it takes us to his target zone of $130 per share for Exxon. Now remember, the market must move over the $95 level for this to happen.
Just Click Here to take a look at Adam's chart work and details for a potential ExxonMobil trade.
Subscribe to all of Adam's Blog Post
Wednesday, November 13, 2013
John is Speaking the "Language of Inflation"
By John Mauldin
My good friend Dylan Grice takes a very interesting tack in the latest issue of his Edelweiss Journal, today's Outside the Box. Rather than attacking our macroeconomic problems directly with economic tools, he approaches them from the point of view of what he calls a "subtle but significant devaluation of language." Now, you might think that the words we use to describe and understand the economy are not in themselves very powerful economic determinants, but Dylan lays out a convincing case to the contrary.
Dylan has fun with a Google app called Ngram Viewer, which allows users to search for the occurrence of words or phrases (or n-grams, which are combinations of letters) in 5.2 million books published between 1500 and 2008, containing 500 billion words, in American English, British English, French, German, Spanish, Russian, and Chinese.
Using Ngram, Dylan and colleagues have detected an exponential increase in the past few decades of such phrases as economic crisis, macroeconomic stability, policy intervention, financial engineering, and wealth management, and in such words as leveraged, arbitrage, risk, and growth. Use of the word financial overtook industrial shortly after 1980, he notes, and now far exceeds it. Likewise, spending now outstrips saving.
OK, so there's a lot of funny money floating around these days, and we like to yak about it. But does that mean our language is influencing our economic outcomes? It's a subtle but powerful process, Dylan says. Most of us appreciate that language shapes our ability to formulate, recall, and modulate the concepts that we then implement as world-changing actions; so language really is fundamental. And, Dylan asserts, when we vastly inflate key terms that we use in describing – and in attempting to manage – the economy, we create the dangerous illusion that we are all-powerful.
Dylan sets us straight in his opening paragraph:
Regular readers of our irregular publication will be aware of our thoughts on inflation, but for those who are not we would summarize them thus: inflation is not measurable. We can summarize our views on money with similar succinctness: it is poorly understood. And as for the economy, we know only this: it is a complex system. From these observations can be derived a straightforward corollary on economic policy makers: trying to control a variable you can’t measure (inflation) with a tool you don’t fully understand (money) in a complex system with hidden, unobservable and non-linear interrelationships (the economy) is a guaranteed way to ensure that most things which happen weren’t supposed to happen.
Today’s language of inflation embeds so many of these false ideas that the full rottenness of what passes for financial thinking today is obscured.
Dylan,
This reads so pure and profound as to make me weep, on one hand for the pleasure of reading your prose and on the other hand for not having written it myself – or maybe more precisely, for not having the skill to write with such beautiful style and clarity. Those sitting around me here at lunch must wonder at my composure and beatitude as I ignore my sushi and pour over your latest. This may be your finest composition; it's at least the best thing of yours I have read. And with such a body of impressive work, that is saying something.
This is a briefer and far more eloquent statement of the driver behind Code Red, that central banks are indeed steering us ever closer to a "monetary trap," an alley, if you will, in which we are very likely to be mugged. This way be dragons.
Code Red made the Wall Street Journal best-seller list this weekend. Thanks to those of you who have bought the book and made that happen. The reviews are quite positive so far. Fixed-income maven Richard Lehman over at Forbes wrote a very nice piece about Code Red this weekend. I am very pleased that he spoke so well of it:
If you read only one book on finance this year, read Code Red: How To Protect Your Savings From the Coming Crisis by John Maudlin and Jonathan Tepper. It is a recounting of current Federal Reserve Bank’s “Code Red” policies for dealing with its mandate of promoting full employment while maintaining financial stability. The Code Red moniker is intended to draw attention to the unprecedented nature of those policies and the dangers we face when they are finally undone.
The book finishes with the most important chapters, what you can do to protect yourself from the almost certain negative fallout these policies will produce. This section alone makes the book a must read…. The authors see the end of a long secular bear market, but on the brink of a new secular bull market. Despite their dour outlook for the short term, they are basically bullish on America.
I am off to NYC early tomorrow morning to be at the NASDAQ for the closing-bell ceremony, to celebrate the launch of a new ETF called ROBO, focused on robotics, automation, and 3-D printing. Then I'll be on Bloomberg radio from 8-9 with Tom Keene and on other media throughout the day. I'll hang around for the evening to be with my old friend Steve Forbes for an interview Thursday morning before heading back to Dallas to see what progress, or lack thereof, has been made on the new apartment.
Finally, my good friend Reid Walker launched an organization called Capital for Kids that raises money from the Dallas investment community (and their clients!) in order to help kids in all manner of activities. They have their big annual soiree Thursday, November 21 at the F.I.G. here in Dallas. Join me and several hundred fun people to help kids who need it. And bring your checkbook. The silent auction is loaded with cool items. Click on the link and look for me when you get there!
Your thinking about how we use words analyst,
John Mauldin, Editor Outside the Box
The Language of Inflation
By Dylan Grice
Edelweiss Journal, No. 14, November 2013Regular readers of our irregular publication will be aware of our thoughts on inflation, but for those who are not we would summarize them thus: inflation is not measurable. We can summarize our views on money with similar succinctness: it is poorly understood. And as for the economy, we know only this: it is a complex system. From these observations can be derived a straightforward corollary on economic policy makers: trying to control a variable you can’t measure (inflation) with a tool you don’t fully understand (money) in a complex system with hidden, unobservable and non-linear interrelationships (the economy) is a guaranteed way to ensure that most things which happen weren’t supposed to happen.
One such unintended consequence of the past three decades’ economic experiments with “inflation” targeting has been the unprecedented inflation of credit which today leaves the world burdened with debt as it has never been burdened before. In Issue 12 we wrote about another unintended consequence of this monetary experiment, a redistribution of wealth from the poor to the rich and, relatedly, a growing distrust both within countries and between them. Since money is based on trust, we concluded, devaluing money devalues trust.
Now, with the help of Google’s fabulous Ngram Viewer (which allows users to search word usage in five million digitized books published since 1600) we’ve recently stumbled upon another possibility, which is that the past three decades’ hidden devaluation of money has caused a subtle but significant devaluation of language too.
This might sound abstract. But language is the machinery with which we conceptualize the world around us. Devaluing language is tantamount to devaluing our ability to think and to understand. Inflation, whether credit inflation or otherwise, messes things up because it sends false signals. For the ordinary steward of capital in such an environment the near impossible task of judging what is real from what is not is difficult enough. But what chance does he have if in addition, his linguistic software has coding errors to which he is oblivious? This is a question which is perplexing us here at Edelweiss and what follows is an exploration of some of the issues as best we can untangle them.
We start our journey into the financial imagination at the beginning, by tracing an important idea which has had a profound effect, namely that society and the economy are things to be manipulated by expert policy makers.
As Taleb opines in his wonderful book Antifragile:
Modernity is not just the postmedieval, postagrarian, and postfeudal historical period as defined in sociology textbooks. It is rather the spirit of an age marked by rationalization (naive rationalization), the idea that society is understandable, hence must be designed, by humans. With it was born statistical theory, hence the beastly bell curve. So was linear science. So was the notion of “efficiency”—or optimization.

As the Taleb quote alludes to, much of today’s pseudo-science was facilitated by a hijacking of the statistical bell curve distribution, the growing psychic predominance of which can be seen here too.

Meanwhile, the growth in what is quite a modern idea of a controllable society can be seen in the following chart.

This new interventionist idea was brought into the realm of economics through the Trojan horse of macroeconomic theory and, in particular, its defining metaphor that the economy is basically an engine. Originally, this metaphor gave economists an excuse to use the same mathematics physicists had used with such great success in the 19th century. The hope was that such tools would afford them similar acclaim. But by the time of the Great Depression Keynes was explaining the slump as being somewhat akin to failure in a car’s electrical system. More recently, Nobel Prize winning clever-clogs Paul Krugman updated the metaphor by describing the current malaise as “magneto trouble.”
Today, the metaphor gives another kind of comfort. One that allows economists to pretend that like an engine, the economy is something that a well-trained expert, perhaps with a PhD from Princeton, should be in control of, and “do things to.” They can optimize it, fine-tune it, or manipulate it in some other way so as to achieve the outcomes most beneficial to “society.” Such experts think they know how to “drive” the economy the way a well-talented astronaut might fly a space shuttle. You’ve probably heard them talk about the economy reaching “escape velocity” or being stuck at “stall speed.” Now you know where they get it from.
They see their job as to constantly monitor the economic engine, check its gauges and dials, ensure its satisfactory performance while all the time standing ready to intervene should anything untoward happen. Thus, writing in January 2012 Larry Summers claimed that “government has no higher responsibility than ensuring economies have an adequate level of demand,” as though doing so were no more complicated than pouring out the correct measure of fuel into a tank. Should the economy ever become too hot and aggregate demand too high, the engineers are supposed to be able to spot this and put the brakes on before anything bad happens. In doing so, the idea is for economic fluctuations to be smoothed, macroeconomic stability achieved and an otherwise unruly world safely delivered into a “ruly” land of milk and honey. But this too is also a new obsession, only really gaining prominence since the 1980s.

The problem is that the metaphor is wrong, the conclusions derived from its use are misleading, and any attempt to achieve “macroeconomic stability” using its prescriptions is doomed to failure. Or at least, now that the results have come in over the past few decades, there isn’t much supporting evidence. If anything, the more obsessed that economists and policy makers became with stabilizing the economy, the less stable the economy became. Certainly the usage of the terms “economic crisis” and “financial crisis” displays a clear trend. (Note the time series ends in 2008; one would expect subsequent updates to show a renewed interest given what happened then and since).

Also, as a matter of empirical fact, the period during which the frequency of financial calamities has clustered is the very same period during which the idea of controlling through policy intervention became so fashionable. The chart below shows the incidence of financial crises as documented by Charles Kindleberger in his classic Manias, Crashes and Panics and updated for the various fiascos of the past decade. As can be seen, financial crises have noticeably clustered around the very period economists started playing God.

Volcker did a wonderful thing in taming CPI inflation in the early 1980s. But this was a watershed moment. His successors used the platform to launch their great experiment. In the name of macroeconomic stabilization they developed the habit of lowering interest rates at the first sighting of any clouds and keeping them low until the sky was blue again. While this all gave the illusion of relatively stable growth, artificially cheap money fueled a background credit inflation the likes of which has never been seen before. The chart below shows total US credit to GDP exploding from 1980 onwards, the great unintended consequence of attempts to stabilize and, of course, the source of the increased instability we have since borne witness to.

But there were other unintended consequences too. The artificial growth in debt saw an artificial growth in the size of the financial sector. And the financial sector did what the financial sector does. It financialized everything. Look at the explosion of these hitherto sparsely used words.


Ideas like these became glamorous because the people using them were becoming rich. In 1981 there was one financial professional in the top fifty names on the Forbes rich list. Thirty years later there were twelve. Cheap credit fueling higher assets benefitted those with access to credit, those who owned assets and the intermediaries who arranged the deals. Typically, such people were already rich. This in turn widened the great disparity between rich and poor we’ve discussed on these pages before, redistributing wealth from the asset poor to the asset rich. Or more simply just from the poor to the rich. Finance became king. Industry became an afterthought, something people “used to do.” Or at least, in the 1980s usage of the term “financial” overtook that of “industrial.”

But what does this all mean? Economists use the notion of “time preference” to describe an individual’s patience, or “discount rate.” The higher his time preference, the higher his discount rate, and someone with a high time preference would have a high preference to spend today compared to tomorrow. Something else which can be detected in these linguistic changes is an underlying change in time preferences. Remember the fundamentals of wealth accumulation: spend less than you earn. It’s no great secret. By working hard and saving you’re more likely to grow wealthy than if you don’t. Those with a lower time preference and a longer time horizon save more and are consequently rewarded more. Patience, thrift and hard work are all a part of the same package, and all serve in the natural process of capital formation and wealth accumulation.
But inflation inverts this calculus. With high price inflation of the traditional variety (i.e., an inflation of high street prices, or CPI), tomorrow’s money is worth less. Thrift makes no sense. Only idiots save. Patience is punished too, the more rational action being to pursue instant gratification by spending money while you can. (It has been well documented by Bernd Widdig, Gerald Feldman and others that during the Weimar hyperinflation, Berlin was simultaneously gripped by a wave of hedonism in which night bars, cabarets and strip clubs expanded as rapidly as the money supply.)
An inflation of credit is different in form but not substance. Why save up for something when you can cheaply borrow the money and have it today? Both types of inflation distort time preferences. Both types of inflation reduce the rewards of patience and thrift. Both types of inflation consequently distort the process through which wealth is created. The following chart reveals this inflated time preference through increased usage of the phrases “right now” and “fast money.”

To say, as almost everyone seems to, that there has been no inflation over the last thirty years and that there is no inflation today is a huge and misleading simplification in our view. What people mean, we think, is that there has been no inflation of the CPIs. Of course, this is true. But there has been a grotesque inflation of credit during this same period, and central banks are pulling out the stops to ensure that it continues. To do this they are engineering a staggering inflation of government bond prices which is inflating nearly all other asset prices. And all the while, there has been a commensurate inflation of economists’ confidence in themselves, of ordinary time preference and, as we shall now see, of expectations for the future. In other words, inflation is everywhere but the CPI.
But to understand the practical consequences it must be understood that language isn’t only a reflection of thought and action. It is a driver too. Language is our cognitive machinery; it shapes our ability to interpret, recall and process concepts. Lera Boroditsky, writing in Edge a few years ago, describes an Australian Aboriginal community whose language references direction in absolute terms, rather than the relative ones Indo-European languages use. Instead of telling someone to “watch out for the ditch ahead,” for example, someone from the tribe might warn a fellow member to “watch out for the ditch southeast.” Boroditsky writes that “the result is a profound difference in navigational ability and spatial knowledge” between the tribesmen and their spatially-relativist Indo-European speaking brethren.
One of the first studies to look into the effect of language on competence makes it even easier to understand why. Studies performed in 1953 on the ability of the indigenous Zuni tribes of New Mexico and Arizona found them to have difficulty retaining and recalling the colors yellow, orange and combinations thereof compared to AngloSaxons performing the same tests. As it happens, the Zuni have no separate words for the colors yellow and orange and therefore insufficient linguistic precision to process the difference. It is often said that sloppy language leads to sloppy thought. These studies and others like them conclude the same from the other direction: linguistic precision leads to cognitive precision. If distinct concepts are poorly defined they will be poorly understood.
It turns out that many of the terms we have long suspected of being hollow and gimmicky are in fact products of this era of financialization, and have only recently gained prominence in usage. As a first example, the following chart shows the Ngram for “wealth management.” It begs several questions. Like, was no one wealthy before 1980? Was there no “wealth” to be managed before then? Have serial asset price inflations and easy credit availability distorted what people understand as “wealth”? Or is it merely that the inflation of all things financial has fostered the creation an entirely new class of professional parasites called “wealth managers”?!

We don’t know. But we attended a lunch recently in which one such “wealth manager” was promoting his services to those around the table. An Italian gentleman claimed to be relieved to have finally found someone who could help him. “At last!” He gasped after the banker’s pitch, “I could really use some help managing my family’s wealth. We own vineyards and a processing plant in Italy, some land and a broiler farm in Spain, some real estate scattered around Europe and the Americas... We are fortunate indeed to have such wealth, but managing it all is increasingly challenging. Can you help?”
The poor banker looked forlorn. Of course, he didn’t mean that kind of wealth, the old-fashioned, productive kind of stuff. He meant the modern, papery, electronic kind. The stuff that blinks at you all day from a screen. Green on an “up” day, red on a “down”... He meant the kind of stuff you can buy and sell. He meant liquidity, we think. His pitch was for the management of the attendees’ “liquid” wealth, presumably because he wanted other people’s money to play with. (We have little doubt our Italian friend would have felt poorer had he sold up his estate and transferred the proceeds to the banker.)
Of course liquidity is an important component of wealth. But liquidity is not wealth. It’s needed to pay the bills that keep the lights on, the house running, the kids at school, provide for unforeseen events and so on. But why does the whole thing need to be liquid? A completely liquid portfolio of investments is important only for those who are intent on trading, and who might need to quickly exit their trades. Such activity may be the niche of a few financial market traders and talented speculators, but of the many who try to build or protect wealth using such methods few succeed. Why should it be so crucial to your average “wealth manager”? What has such activity got to do with the management of real wealth? And anyway, how is someone as confused by the difference between liquidity and wealth as they are between trading and investing supposed to manage anyone’s wealth, exactly? The explosion of wealth managers has seen a commensurate increase in the fetish for things which are liquid, a contrasting and relatively new fear of things which are illiquid.

Another linguistic distortion which has arisen during this age of financialization can be seen in the notion of “risk.” Indeed, the ngram for “risk management” looks similar to that of “wealth management” and again we ask ourselves similar questions. Was there no “risk” to be managed prior to 1980? Has the nature of “risk” changed since then? Or has the conceptualization and therefore understanding of risk changed during this time?

We suspect the latter. Within the space of a generation, bankers have become obsessed with “value-at-risk,” “risk-budgets” and more recently “risk-parity.” All such concepts use the volatility of market prices as the sole input into the calculation of “risk.” But price volatility is not risk and it is frankly dangerous to think that it is. There are so many different types of risks to consider in the practice of capital stewardship that we could write a book about them. Some are to be avoided without exception, others are to be embraced.
But all require judgment because none are measurable. In the broadest sense possible, the greatest and most fundamental risk is the risk of not knowing what you’re doing. To the extent these “risk models” trick “risk managers” into thinking they do, they are dangerous because they blind users to the true nature of risk. The paradoxical outcome is that such risk managers are making the financial world far riskier than it would otherwise be.
Perhaps the most concerning distortion though is the obsession with “growth.” So deeply ingrained is it in our thinking today that one could be forgiven for thinking it has always been thus. But it is actually quite new. Increasingly, we see it as a part of the widespread though subtle inflation of expectations.

As can be seen, this growth fetish also seems to have developed during the credit inflation. Note also the relation to inflated time preferences. The fixation on growth can encourage behavior which may seem beneficial in the short term but is detrimental to the long term. The debt-overhung world we live in today is a very good macro-level example of the long-run damage this growth obsession can cause. But the corporate world is strewn with them. Most companies even tie executive compensation to implied or explicit EPS growth targets. These, not to mention the primacy of expected growth in the broader financial community, create a pressure on management to behave in a manner they otherwise might not. It also encourages executives to focus more on their stock price than on their business, which can be quite devastating.
For example, a survey of 169 CFOs polled for a recent study into earnings quality found that 20% “manage their earnings to misrepresent economic performance” in any given period. In their book Financial Shenanigans, Howard M. Schilit and Jeremy Perler write that “investors are beginning to harbor a troubling suspicion about corporate financial reporting: that management now plays tricks... Sadly, these suspicions are well founded.” Indeed, the bulk of the frauds analyzed in their book turn out to be perpetrated by executives fearful of disappointing the growth expectations they had previously fostered among their shareholders.

Don’t misunderstand us, there is nothing wrong with growth. We like growth and we like the companies we have ownership stakes in to grow. But we like growth as the outcome of an outstanding business process. An enterprise which is better at solving its customers’ problems than its competitors will soon find itself with more customers. Such a business will inevitably grow and this is a natural and good thing. But a company pursuing growth for the sake of it, or because Wall Street demands it, or because remuneration has been structured around it, is less likely to be concerned with the long-term health of the business. The pressure on them to engage in the financial shenanigans that Schilit and Perler document in their book will be greater, all else equal. So it is no longer necessary to merely keep a weather eye on the manner in which companies report their numbers. Today, stewards of capital must also make sure executives haven’t succumbed to the growth disease.
Recently, for example, we examined a company which is regionally dominant in an industry we are interested in and have some knowledge of. But its forty-six page investor roadshow presentation used the word “growth” forty-eight times. The company in the sector we already own a stake in mentioned growth in its forty-four page presentation only four times. Unsurprisingly, the company we investigated had twice as much debt as the one we already owned and had doubled its share count in the last fifteen years (ours had steadily and consistently shrunk its own). Unsurprisingly again, Mr. Market gave the growth-obsessed company a higher multiple than our one because Mr. Market loves growth. But to us, this tendency suggests a company’s clear willingness to either take or ignore risks with its health in the name of its cherished growth. We didn’t pursue our interest.
On a related note, we’ve recently come to the conclusion that there seems to be a widespread misunderstanding of what “capital” is. We happened to stumble across a fabulous book called Talent is Overrated (no sarcastic emails on why we were so attracted to such a title, please) written by the well-regarded Forbes journalist Geoff Colvin. To be clear upfront, is an excellent book which we learned a lot from.
But consider the following extract (our emphasis):
For roughly five hundred years—from the explosion of commerce and wealth that accompanied the Renaissance until the late twentieth century—the scarce resource in business was financial capital. If you had it, you had the means to create more wealth, and if you didn’t, you didn’t. That world is now gone. Today, in a change that is historically quite sudden, financial capital is abundant. The scarce resource is no longer money...
What he meant, we think, was printing more money. But it’s not what he said. He had confused money with capital as Mr. Colvin did in his book.

Like the Zuni tribes struggling to deal with the difference between yellow and orange without sufficient linguistic precision, we face the same problem in our financial system. As stock markets blink green on more QE supposedly making us all more wealthy, the developed world is saving less than it has at any time since WWII. And as central banks are conjuring up ever more liquidity, more thoughtful observers scratch their heads over the lack of collateral in the system. Of course, the problem is solvency, not liquidity. Capital comes from savings, and the policy of cheap credit with its inflation of time preference has encouraged spending, not saving. Scarce capital is growing ever scarcer.

One day, the price of capital will reflect its underlying scarcity, because one day it must. But in the meantime we think very carefully about the capital requirements of the businesses we own, growing increasingly wary of those which depend on artificially cheap “financial capital” for their survival. We note in passing that physical gold bullion is the oldest and purest capital there is...
What is the moral of this story for the steward of capital? Success in the long run requires that thought and action be fully independent from the false ideas of the herd. Yet today’s language of inflation embeds so many of these false ideas that the full rottenness of what passes for financial thinking today is obscured. One increasingly reads of capital stewards complaining that things seem more difficult today. We think it’s because they are. We are also increasingly mindful of conversations with friends, family and colleagues that reveal a widespread perception that something is very wrong, though people can’t quite put their finger on what it is.
As we have just argued, we think the answer is that the inflation of credit has driven an inflation of asset prices, which has driven an inflation of future expectations, which has driven an inflation of time preference... and that while the consequences of these various inflations are profound, the new language of inflation which it has spawned is shallow. Therefore, not only is there insufficient capital to ensure future prosperity and insufficient realism to deal with the future this implies, there is insufficient linguistic precision for most people to articulate the problem let alone understand it. And when language itself becomes so grotesquely distorted, how does one go about substituting the customers’ unattainable hopes and expectations of never-ending growth with the need for principled and honest action?
Like Outside the Box?
Sign up today and get each new issue delivered free to your inbox.
John Carter on "What Wallstreet Doesn't Want you to Know"
Subscribe to:
Posts (Atom)
