Tuesday, July 22, 2014

The TRUTH about China’s Massive Gold Hoard

By Jeff Clark, Senior Precious Metals Analyst

I don’t want to say that mainstream analysts are stupid when it comes to China’s gold habits, but I did look up how to say that word in Chinese…..


One report claims, for example, that gold demand in China is down because the yuan has fallen and made the metal more expensive in the country. Sounds reasonable, and it has a grain of truth to it. But as you’ll see below, it completely misses the bigger picture, because it overlooks a major development with how the country now imports precious metals.

I’ve seen so many misleading headlines over the last couple months that I thought it time to correct some of the misconceptions. I’ll let you decide if mainstream North American analysts are stupid or not.

The basis for the misunderstanding starts with the fact that the Chinese think differently about gold. They view gold in the context of its role throughout history and dismiss the Western economist who arrogantly declares it an outdated relic. They buy in preparation for a new monetary order—not as a trade they hope earns them a profit.

Combine gold’s historical role with current events, and we would all do well to view our holdings in a slightly more “Chinese” light, one that will give us a more accurate indication of whether we have enough, of what purpose it will actually serve in our portfolio, and maybe even when we should sell (or not).

The horizon is full of flashing indicators that signal the Chinese view of gold is more prudent for what lies ahead. Gold will be less about “making money” and more about preparing for a new international monetary system that will come with historic consequences to our way of life.

With that context in mind, let’s contrast some recent Western headlines with what’s really happening on the ground in China. Consider the big picture message behind these developments and see how well your portfolio is geared for a “Chinese” future…

Gold Demand in China Is Falling

This headline comes from mainstream claims that China is buying less gold this year than last. The International Business Times cites a 30% drop in demand during the “Golden Week” holiday period in May. Many articles point to lower net imports through Hong Kong in the second quarter of the year. “The buying frenzy, triggered by a price slump last April, has not been repeated this year,” reports Kitco.

However, these articles overlook the fact that the Chinese government now accepts gold imports directly into Beijing.

In other words, some of the gold that normally went through Hong Kong is instead shipped to the capital. Bypassing the normal trade routes means these shipments are essentially done in secret. This makes the Western headline misleading at best, and at worst could lead investors to make incorrect decisions about gold’s future.

China may have made this move specifically so its import figures can’t be tracked. It allows Beijing to continue accumulating physical gold without the rest of us knowing the amounts. This move doesn’t imply demand is falling—just the opposite.

And don’t forget that China is already the largest gold producer in the world. It is now reported to have the second largest in-ground gold resource in the world. China does not export gold in any meaningful amount. So even if it were true that recorded imports are falling, it would not necessarily mean that Chinese demand has fallen, nor that China has stopped accumulating gold.

China Didn’t Announce an Increase in Reserves as Expected

A number of analysts (and gold bugs) expected China to announce an update on their gold reserves in April. That’s because it’s widely believed China reports every five years, and the last report was in April 2009. This is not only inaccurate, it misses a crucial point.

First, Beijing publicly reported their gold reserve amounts in the following years:
  • 500 tonnes at the end of 2001
  • 600 tonnes at the end of 2002
  • 1,054 tonnes in April 2009.
Prior to this, China didn’t report any change for over 20 years; it reported 395 tonnes from 1980 to 2001.
There is no five-year schedule. There is no schedule at all. They’ll report whenever they want, and—this is the crucial point—probably not until it is politically expedient to do so.

Depending on the amount, the news could be a major catalyst for the gold market. Why would the Chinese want to say anything that might drive gold prices upwards, if they are still buying?

Even with All Their Buying, China’s Gold Reserve Ratio Is Still Low

Almost every report you’ll read about gold reserves measures them in relation to their total reserves. The US, for example, has 73% of its reserves in gold, while China officially has just 1.3%. Even the World Gold Council reports it this way.

But this calculation is misleading. The U.S. has minimal foreign currency reserves—and China has over $4 trillion. The denominators are vastly different.

A more practical measure is to compare gold reserves to GDP. This would tell us how much gold would be available to support the economy in the event of a global currency crisis, a major reason for having foreign reserves in the first place and something Chinese leaders are clearly preparing for.

The following table shows the top six holders of gold in GDP terms. (Eurozone countries are combined into one.) Notice what happens to China’s gold to GDP ratio when their holdings move from the last reported 1,054-tonne figure to an estimated 4,500 tonnes (a reasonable figure based on import data).

Country Gold
(Tonnes)
Value US$ B
($1300 gold)
GDP US$ B
(2013)
Gold
Percent
of GDP
Eurozone* 10,786.3 $450.8 12,716.30 3.5%
US 8,133.5 $339.9 16,799.70 2.0%
China** 4,500.0 $188.1 9,181.38 2.0%
Russia 1,068.4 $44.7 2,118.01 2.1%
India 557.7 $23.3 1,870.65 1.2%
Japan 765.2 $32.0 4,901.53 0.7%
China 1,054.1 $44.1 9,181.38 0.5%
*including 503.2 tonnes held by ECB
**Projection
Sources: World Gold Council, IMF, Casey Research proprietary calculations


At 4,500 tonnes, the ratio shows China would be on par with the top gold holders in the world. In fact, they would hold more gold than every country except the U.S. (assuming the U.S. and EU have all the gold they say they have). This is probably a more realistic gauge of how they determine if they’re closing in on their goals.


This line of thinking assumes China’s leaders have a set goal for how much gold they want to accumulate, which may or may not be the case. My estimate of 4,500 tonnes of current gold reserves might be high, but it may also be much less than whatever may ultimately satisfy China’s ambitions. Sooner or later, though, they’ll tell us what they have, but as above, that will be when it works to China’s benefit.

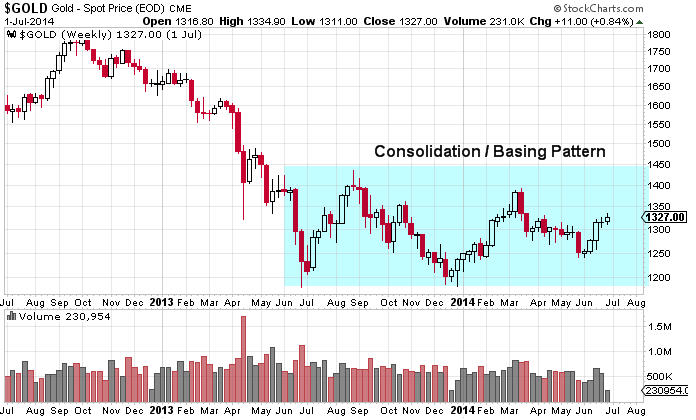
The Gold Price Is Weak Because Chinese GDP Growth Is Slowing

Most mainstream analysts point to the slowing pace of China’s economic growth as one big reason the gold price hasn’t broken out of its trading range. China is the world’s largest gold consumer, so on the surface this would seem to make sense. But is there a direct connection between China’s GDP and the gold price?
Over the last six years, there has been a very slight inverse correlation (-0.07) between Chinese GDP and the gold price, meaning they act differently slightly more often than they act the same. Thus, the Western belief characterized above is inaccurate. The data signal that, if China’s economy were to slow, gold demand won’t necessarily decline.

The fact is that demand is projected to grow for reasons largely unrelated to whether their GDP ticks up or down. The World Gold Council estimates that China’s middle class is expected to grow by 200 million people, to 500 million, within six years. (The entire population of the U.S. is only 316 million.) They thus project that private sector demand for gold will increase 25% by 2017, due to rising incomes, bigger savings accounts, and continued rapid urbanization. (170 cities now have over one million inhabitants.) Throw in China’s deep seated cultural affinity for gold and a supportive government, and the overall trend for gold demand in China is up.

The Gold Price Is Determined at the Comex, Not in China

One lament from gold bugs is that the price of gold—regardless of how much people pay for physical metal around the world—is largely a function of what happens at the Comex in New York.

One reason this is true is that the West trades in gold derivatives, while the Shanghai Gold Exchange (SGE) primarily trades in physical metal. The Comex can thus have an outsized impact on the price, compared to the amount of metal physically changing hands. Further, volume at the SGE is thin, compared to the Comex.
But a shift is underway…..

In May, China approached foreign bullion banks and gold producers to participate in a global gold exchange in Shanghai, because as one analyst put it, “The world’s top producer and importer of the metal seeks greater influence over pricing.”

The invited bullion banks include HSBC, Standard Bank, Standard Chartered, Bank of Nova Scotia, and the Australia and New Zealand Banking Group (ANZ). They’ve also asked producing companies, foreign institutions, and private investors to participate.

The global trading platform was launched in the city’s “pilot free-trade zone,” which could eventually challenge the dominance of New York and London.

This is not a proposal; it is already underway.

Further, the enormous amount of bullion China continues to buy reduces trading volume in North America. The Chinese don’t sell, so that metal won’t come back into the market anytime soon, if ever. This concern has already been publicly voiced by some on Wall Street, which gives you an idea of how real this trend is.
There are other related events, but the point is that going forward, China will have increasing sway over the gold price (as will other countries: the Dubai Gold and Commodities Exchange is to begin a spot gold contract within three months).

And that’s a good thing, in our view.

Don’t Be Ridiculous; the US Dollar Isn’t Going to Collapse

In spite of all the warning signs, the US dollar is still the backbone of global trading. “It’s the go-to currency everywhere in the world,” say government economists. When a gold bug (or anyone else) claims the dollar is doomed, they laugh.

But who will get the last laugh?

You may have read about the historic energy deal recently made between Chinese President Xi Jinping and Russian President Vladimir Putin. Over the next 30 years, about $400 billion of natural gas from Siberia will be exported to China. Roughly 25% of China’s energy needs will be met by 2018 from this one deal. The construction project will be one of the largest in the world. The contract allows for further increases, and it opens Russian access to other Asian countries as well. This is big.

The twist is that transactions will not be in US dollars, but in yuan and rubles. This is a serious blow to the petrodollar.

While this is a major geopolitical shift, it is part of a larger trend already in motion:
  • President Jinping proposed a brand-new security system at the recent Asian Cooperation Conference that is to include all of Asia, along with Russia and Iran, and exclude the US and EU.
  • Gazprom has signed agreements with consumers to switch from dollars to euros for payments. The head of the company said that nine of ten consumers have agreed to switch to euros.
  • Putin told foreign journalists at the St. Petersburg International Economic Forum that “China and Russia will consider further steps to shift to the use of national currencies in bilateral transactions.” In fact,a yuan-ruble swap facility that excludes the greenback has already been set up.
  • Beijing and Moscow have created a joint ratings agency and are now “ready for transactions… in rubles and yuan,” said the Russian Finance Minister Anton Siluanov. Many Russian companies have already switched contracts to yuan, partly to escape Western sanctions.
  • Beijing already has in place numerous agreements with major trading partners, such as Brazil and the Eurozone, that bypass the dollar.
  • Brazil, Russia, India, China, and South Africa (the BRICS countries) announced last week that they are “seeking alternatives to the existing world order.” The five countries unveiled a $100 billion fund to fight financial crises, their version of the IMF. They will also launch a World Bank alternative, a new bank that will make loans for infrastructure projects across the developing world.
You don’t need a crystal ball to see the future for the US dollar; the trend is clearly moving against it. An increasing amount of global trade will be done in other currencies, including the yuan, which will steadily weaken the demand for dollars.

The shift will be chaotic at times. Transitions this big come with complications, and not one of them will be good for the dollar. And there will be consequences for every dollar based investment. U.S. dollar holders can only hope this process will be gradual. If it happens suddenly, all U.S. dollar based assets will suffer catastrophic consequences. In his new book, The Death of Money, Jim Rickards says he believes this is exactly what will happen.

The clearest result for all U.S. citizens will be high inflation, perhaps at runaway levels—and much higher gold prices.

Gold Is More Important than a Profit Statement

Only a deflationary bust could keep the gold price from going higher at some point. That is still entirely possible, yet even in that scenario, gold could “win” as most other assets crash. Otherwise, I’m convinced a mid-four-figure price of gold is in the cards.

But remember: It’s not about the price. It’s about the role gold will serve protecting wealth during a major currency upheaval that will severely impact everyone’s finances, investments, and standard of living.
Most advisors who look out to the horizon and see the same future China sees believe you should hold 20% of your investable assets in physical gold bullion. I agree. Anything less will probably not provide the kind of asset and lifestyle protection you’ll need.

In the meantime, don’t worry about the gold price. China’s got your back.

You don’t have to worry about silver, either, which we think holds even greater potential for investors. In the July issue of my newsletter, BIG GOLD, we show why we’re so bullish on gold’s little cousin.

And we provide two silver bullion discounts exclusively for subscribers, and name our top silver pick of the year.

Of course, we also have all our best buys in the gold mining sector as well.

Click here to get it all with a 90 day risk free trial to our inexpensive BIG GOLD newsletter

The article The TRUTH about China’s Massive Gold Hoard was originally published at Casey Research


Get your free trend analysis for the junior miners ETF - GDXJ....Just Click Here!

Sunday, July 20, 2014

Beware of Flashy Stock Repurchases When The Market Is on The Rise

By Andrey Dashkov

Retail giant Bed Bath & Beyond just announced plans to buy back another $2 billion in shares, which the company will start doing after it completes its current share repurchase program. You’ve seen it before: Press releases emphasize that buybacks return value to shareholders, analysts sometimes rely on repurchases to spot a stock to write up next, and management likes to tout their focus on shareholder returns. But what’s the real story? Why would a company buy its own shares?


There are but a few situations when returning cash to shareholders instead of paying dividends or investing in new projects is prudent:
  • The company has largely exhausted investment opportunities that would generate a positive net present value (NPV).
  • The stock is trading below its intrinsic value; or
  • The tax on dividends is so high compared to the capital gains tax that it makes sense to boost the share price and let shareholders enjoy the extra return instead of receiving heavily taxed dividends.
When these situations happen we support repurchases. In the reality, however, managers often have their own reasons to buy back shares; let’s look at the more popular ones.

First, management’s compensation is often based on share price performance or earnings based metrics like earnings per share (EPS), which buybacks are designed to boost.

Second, higher share price increases the value of a company’s options. Managers are often shareholders, too, but unlike you and me, they have direct access to the Treasury. When managers own a lot of their own company’s stock, they may have too much skin in the game. This may skew their preferences toward increasing the share price at the expense of long term business growth.

Third, share buybacks became a standard (and often abused) signal to the market that: a) the company’s stock is undervalued, and b) that management takes care of the shareholders. Both of these statements may be correct in isolation, based on the company’s fundamentals and management practices. Nonetheless, a buyback should not convince you that either is true.

One additional reason is often overlooked. Many a CEO has been fired for an acquisition that did not work out. When the decision is made to dump the acquisition, it is accompanied by a write off against earnings, sometimes worth billions of dollars. Wall Street armchair quarterbacks are quick to point out how much better off shareholders would have been if they had just paid out what they lost in dividends. Buying back company shares, with all the accompanied hoopla, is less likely to be a career threatening move.

Linking the two subjects together makes for nice copy; however, keep it in perspective. For example, a technology company that realizes their product line is becoming obsolete will often make acquisitions to increase their product line market share, or move them into a new business with long term potential. Buying back company stock, then having to go into the market and borrow at high interest rates, might be the exact wrong move. The key is making the right acquisitions for the company to continue to grow and pay dividends for the next generation.

In fact, managers have proven to be pretty bad stock pickers even when they have only one stock to pick. As my colleague Chris Wood showed in A Look at Stock Buybacks, managements have bought shares of their own companies at pretty bad times in the past. Moreover, the expectations of higher valuation based on higher EPS did not always materialize. Even though a lot of investors use P/E as their main gauge of value (which they shouldn’t), there is no convincing evidence that buybacks can support high valuation multiples in the long term.

Your Bottom Line


History has shown that the only value-creating buybacks were the ones carried out when stocks were deeply undervalued. In those instances, the repurchases helped companies outperform the market. But overall the optimism and confidence inducing press releases that accompany buybacks should be taken with a huge grain of salt.

As a rule of thumb, beware of increased buybacks when the market is on the rise (everybody is an investment guru when everything is going up) or when management compensation is closely tied to the share price performance or earnings based metrics. Companies with better corporate governance may fare better when it comes to managing conflicts of interest, but there is a significant vested interest there that investors should be aware of. Don’t mistake noise for a sign is all.

When it comes to returning value to shareholders, we appreciate companies that invest in long term projects—or pay dividends. Despite the potential tax implications, the yield strapped investors may be better served with a special dividend these days than with a promise of a better price in the future.

Learn more ways to cut through press rhetoric by signing up for our free weekly e-letter, Miller’s Money Weekly, where my colleagues and I share timely financial insight tailored for seniors and conservative investors alike.

Sign up here, and we’ll send a complimentary copy straight to your inbox every Thursday


Get the complete schedule for the Premier Trader University free trading webinars....Just Click Here!
 

Wednesday, July 16, 2014

Hoisington Investment Management: Quarterly Review and Outlook, Second Quarter 2014

By John Mauldin

This week’s Outside the Box is from an old friend to regular readers. It’s time for our Quarterly Review & Outlook from Lacy Hunt of Hoisington Investment Management, who leads off this month with a helpful explanation of the relationship between the U.S. GDP growth rate and 30 year treasury yields. That’s an important relationship, because long term interest rates above nominal GDP growth (as they are now) tend to retard economic activity and vice versa.

The author adds that the average four quarter growth rate of real GDP during the present recovery is 1.8%, well below the 4.2% average in all of the previous post war expansions; and despite six years of federal deficits totaling $6.27 trillion and another $3.63 trillion in quantitative easing by the Fed, the growth rate of the economy continues to erode.

So what gives? We’re simply too indebted, says Lacy; and too much of the debt is nonproductive. (Total U.S. public and private debt rose to 349.3% of GDP in the first quarter, up from 343.7% in the third quarter of 2013.) And as Hyman Minsky and Charles Kindleberger showed us, higher levels of debt slow economic growth when the debt is unbalanced toward the type of borrowing that doesn’t create an income stream sufficient to repay principal and interest.

And it’s not just the US. Lacy notes that the world’s largest economies have a higher total debt to GDP ratio today than at the onset of the Great Recession in 2008, and foreign households are living farther above their means than they were six years ago.

Simply put, the developed (and much of the developing) world is fast approaching the end of a 60-year-long debt supercycle, as I (hope I) conclusively demonstrated in Endgame and reaffirmed in Code Red.
Hoisington Investment Management Company (www.Hoisingtonmgt.com) is a registered investment advisor specializing in fixed income portfolios for large institutional clients. Located in Austin, Texas, the firm has over $5 billion under management and is the sub adviser of the Wasatch-Hoisington U.S. Treasury Fund (WHOSX).

Some readers may have noticed that there was no Thoughts from the Frontline in their inboxes this weekend. As has happened only once or twice in the last 14 years, I found myself in an intellectual cul-de-sac, and there was not enough time to back out. Knowing that I was going to be involved in a fascinating conference over the weekend, I had planned to do a rather simple analysis of a new book on how GDP is constructed. But as I got deeper into thinking about the topic and doing more research, I remembered something I read 20 years ago about the misleading nature of GDP, and I realized that a simple analysis just wouldn’t cut it.

Rather than write something that would’ve been inadequate and unsatisfying, I decided to just put it off till next week. Your time and attention are quite valuable, and I try not to waste them. But there will be no excuses this weekend.

The conference I attended was organized by Great Point Partners, a hedge fund and private equity firm focusing on medical and biotechnology. I really had not seen the program until I arrived and did not realize what a powerful lineup of industry leaders would be presenting on some of the latest technologies and research. The opportunity was too good to pass up, as it is so rare that any of us get to sit down with people who are responsible for the science we all read about.

I had breakfast with a small group of 11 readers/investors one morning and learned a lot by asking them what their favorite investing passion was. Although everyone had concerns, they all had areas in which they were quite bullish. I find that everywhere I go. It was interesting, in that they all expected me to be far more negative about things than I am. I guess when you write about macroeconomics as much as I do, and there’s as much wrong with it as there is, you kind of end up being labeled as a Gloomy Gus. I am actually quite optimistic about the long-term future of humanity, but I’ll admit there will be a few bumps along the way. Given how many bumps there have already been, just in my own lifetime, and given that we seem to have gotten through them, I can’t help but be optimistic that we’ll get through the next round.

It was a fascinating weekend, made all the more so by my very gracious hosts, Jeff Jay and David Kroin, Managing Directors of Great Point. They and their staff made sure I could enjoy my time on Nantucket Island. It was my first visit to the area, and I hope it won’t be the last.

Last night I had dinner with Art Cashin, Barry Ritholtz, Jack Rivkin, and Dan Greenhaus. It was a raucous, intellectually enlivening evening, and our conversation ranged from macroeconomics to our favorite new technologies. Jack Rivkin is involved with Idealab, and one of his favorites is that he sees the eventual end of Amazon as 3-D printing becomes more available. Given how Bezos has adapted over the years, I’m not so sure. Jack and Barry will join me in Maine in a few weeks, where we will again join the debate about bull and bear markets.

Now let’s go to Lacy and think about the intersection of velocity and money supply and what it says about future growth potential. I have two full days of meetings with my partners and others here in New York before I return to Dallas, and then I get to stay home for a few weeks. There are lots of new plans in the works. And lots of reading to do between meetings. Have a great week!

Your hoping to be able to stay optimistic analyst,
John Mauldin, Editor
Outside the Box
subscribers@mauldineconomics.com


Hoisington Investment Management – Quarterly Review and Outlook, Second Quarter 2014

Treasury Bonds Undervalued

Thirty year treasury bonds appear to be undervalued based on the tepid growth rate of the U.S. economy. The past four quarters have recorded a nominal “top line” GDP expansion of only 2.9%, while the bond yield remains close to 3.4%. Knut Wicksell (1851-1926) noted that the natural rate of interest, a level that does not tend to slow or accelerate economic activity, should approximate the growth rate of nominal GDP. Interest rates higher than the top line growth rate of the economy, which is the case today, would mean that resources from the income stream of the economy would be required to pay for the higher rate of interest, thus slowing the economy. Wicksell preferred to use, not a risk free rate of interest such as thirty year treasury bonds, but a business rate of interest such as BAA corporates.


As chart one attests, interest rates below nominal GDP growth helps to accelerate economic activity and vice versa. Currently the higher interest rates are retarding economic growth, suggesting the next move in interest rates is lower.

To put the 2.9% change in nominal GDP over the past four quarters in perspective, it is below the entry point of any post-war recession. Even adjusting for inflation the average four-quarter growth rate in real GDP for this recovery is 1.8%, well below the 4.2% average in all of the previous post war expansions.

Fisher's Equation of Exchange


Slow nominal growth is not surprising to those who recall the American economist Irving Fisher’s (1867-1947) equation of exchange that was formulated in 1911. Fisher stated that nominal GDP is equal to money (M) times its turnover or velocity (V), i.e., GDP=M*V. Twelve months ago money (M) was expanding about 7%, and velocity (V) was declining at about a 4% annual rate. If you assume that those trends would remain in place then nominal GDP should have expanded at about 3% over the ensuing twelve months, which is exactly what occurred. Projecting further into 2014, the evidence of a continual lackluster expansion is clear. At the end of June money was expanding at slightly above a 6% annual rate, while velocity has been declining around 3%. Thus, Fisher’s formula suggests that another twelve months of a 3% nominal growth rate is more likely than not. With inflation widely expected to rise in the 1.5% to 2.0% range, arithmetic suggests that real GDP in 2014 will expand between 1.0% and 1.5% versus the average output level of 2013. This rate of expansion will translate into a year over year growth rate of around 1% by the fourth quarter of 2014. This is akin to pre-recessionary conditions.

An Alternative View of Debt


The perplexing fact is that the growth rate of the economy continues to erode despite six years of cumulative deficits totaling $6.27 trillion and the Federal Reserve’s quantitative easing policy which added net $3.63 trillion of treasury and agency securities to their portfolio. Many would assume that such stimulus would be associated with a booming economic environment, not a slowing one.

Readers of our letters are familiar with our long-standing assessment that the cause of slower growth is the overly indebted economy with too much non productive debt. Rather than repairing its balance sheet by reducing debt, the U.S. economy is starting to increase its leverage. Total debt rose to 349.3% of GDP in the first quarter, up from 343.7% in the third quarter of 2013.

It is possible to cast an increase in debt in positive terms since it suggests that banks and other financial intermediaries are now confident and are lowering credit standards for automobiles, home equity, credit cards and other types of loans. Indeed, the economy gets a temporary boost when participants become more indebted. This conclusion was the essence of the pioneering work by Eugen von Böhm-Bawerk (1851-1914) and Irving Fisher which stated that debt is an increase in current spending (economic expansion) followed by a decline in future spending (economic contraction).

In concert with this view, but pinpointing the negative aspect of debt, contemporary economic research has corroborated the views of Hyman Minsky (1919-1996) and Charles Kindleberger (1910-2003) that debt slows economic growth at higher levels when it is skewed toward the type of borrowing that will not create an income stream sufficient to repay principal and interest.

Scholarly studies using very sophisticated analytical procedures conducted in the U.S. and abroad document the deleterious effects of high debt ratios. However, the use of a balance sheet measure can be criticized in two ways. First, income plays a secondary role, and second, debt ratios are not an integral part of Keynesian economic theory.

We address these two objections by connecting the personal saving rate (PSR) which is at the core of Keynesian economic analysis, and the private debt to GDP ratio that emerges from non-Keynesian approaches. Our research indicates that both the “Non Keynesian” private debt to GDP ratios, as well as the “Keynesian” PSR, yield equivalent analytical conclusions.

The Personal Saving Rate (PSR) and the Private Debt Linkage


The PSR and the private debt to GDP ratio should be negatively correlated over time. When the PSR rises, consumer income exceeds outlays and taxes. This means that the consumer has the funds to either acquire assets or pay down debt, thus closely linking the balance sheet and income statement. When the PSR (income statement measure) rises, savings (balance sheet measure) increases unless debt (also a balance sheet measure) declines, thus the gap between the Keynesian income statement focus and the non-Keynesian debt ratio focus is bridged.


The PSR and private debt to GDP ratio are, indeed, negatively correlated (Chart 2). The correlation should not, however, be perfect since the corporate sector is included in the private debt to GDP ratio while the PSR measures just the household sector. We used the total private sector debt ratio because the household data was not available in the years leading up to the Great Depression.

The most important conceptual point concerning the divergence of these two series relates to the matter of the forgiveness of debt by the financial sector, which will lower the private debt to GDP ratio but will not raise the PSR. The private debt to GDP ratio fell sharply from the end of the recession in mid-2009 until the fourth quarter of 2013, temporarily converging with a decline in the saving rate. As such, much of the perceived improvement in the consumer sector’s financial condition occurred from the efforts of others. The private debt to GDP ratio in the first quarter of 2014 stood at 275.4%, a drop of 52.5 percentage points below the peak during the recession. The PSR in the latest month was only 1.7 percentage points higher than in the worst month of the recession. Importantly, both measures now point in the direction of higher leverage, with the PSR showing a more significant deterioration. From the recession high of 8.1%, the PSR dropped to 4.8% in April 2014.

Historical Record


The most recently available PSR is at low levels relative to the past 114 years and well below the long-term historical average of 8.5% (Chart 3). The PSR averaged 9.4% during the first year of all 22 recessions from 1900 to the present. However this latest reading of 4.8% is about the same as in the first year of the Great Depression and slightly below the 5% reading in the first year of the Great Recession.


In Dr. Martha Olney’s (University of California, Berkeley and author of Buy Now, Pay Later) terminology, when the PSR falls households are buying now but will need to pay later. Contrarily, if the PSR rises households are improving their future purchasing power. A review of the historical record leads to two additional empirical conclusions. First, the trend in the PSR matters. A decline in the PSR when it has been falling for a prolonged period of time is more significant than a decline after it has risen. Second, the significance of any quarterly or annual PSR should be judged in terms of its long term average.

For example, multi-year declines occurred as the economy approached both the Great Recession of 2008 and the Great Depression of 1929. In 1925 the PSR was 9.2%, but by 1929 it had declined by almost half to 4.7%. The PSR offered an equal, and possibly even better, signal as to the excesses of the 1920s than did the private debt to GDP ratio. Both the level of PSR and the trend of its direction are significant meaningful inputs.

John Maynard Keynes (1883-1946) correctly argued that the severity of the Great Depression was due to under-consumption or over saving. What Keynes failed to note was that the under consumption of the 1930s was due to over spending in the second half of the 1920s. In other words, once circumstances have allowed the under saving event to occur, the net result will be a long period of economic under performance.
Keynes, along with his most famous American supporter, Alvin Hansen (1887-1975), argued that the U.S. economy would face something he termed “an under-employment equilibrium.” They believed the U.S. economy would return to the Great Depression after World War II ended unless the federal government ran large budget deficits to offset weakness in consumer spending. The PSR averaged 23% from 1942 through 1946, and the excessive indebtedness of the 1920s was reversed. Consumers had accumulated savings and were in a position to fuel the post WWII boom. The economy enjoyed great prosperity even though the budget deficit was virtually eliminated. The concerns about the under employment equilibrium were entirely wrong. In Keynes’ defense, the PSR statistics cited above were not known at the time but have been painstakingly created by archival scholars since then.

Implications for 2014-2015


In previous letters we have shown that the largest economies in the world have a higher total debt to GDP today than at the time of the Great Recession in 2008. PSRs also indicate that foreign households are living further above their means than six years ago. According to the OECD, Japan’s PSR for 2014 will be 0.6%, virtually unchanged from 2008. The OECD figure is likely to turn out to be very optimistic as the full effects of the April 2014 VAT increase takes effect, and a negative PSR for the year should not be ruled out. In addition, Japan’s PSR is considerably below that of the U.S. The Eurozone PSR as a whole is estimated at 7.9%, down 1.5 percentage points from 2008. Thus, in aggregate, the U.S., Japan and Europe are all trying to solve an under-saving problem by creating more under-saving. History indicates this is not a viable path to recovery. [reference: Atif Mian and Amir Sufi,. House of Debt, University of Chicago Press 2014]
Japan confirms the experience in the United States because their PSR has declined from over 20% in the financial meltdown year of 1989 to today’s near zero level. Japan, unlike the U.S. in the 1940s, has moved further away from financial stability. Despite numerous monetary and fiscal policy maneuvers that were described as extremely powerful, the end result was that they have not been successful.

U.S. Yields Versus Global Bond Yields


Table one compares ten-year and thirty year government bond yields in the U.S. and ten major foreign economies. Higher U.S. government bond yields reflect that domestic economic growth has been considerably better than in Europe and Japan, which in turn, mirrors that the U.S. is less indebted. However, the U.S. is now taking on more leverage, indicating that our growth prospects are likely to follow the path of Europe and Japan.


With U.S. rates higher than those of major foreign markets, investors are provided with an additional reason to look favorably on increased investments in the long end of the U.S. treasury market. Additionally, with nominal growth slowing in response to low saving and higher debt we expect that over the next several years U.S. thirty year bond yields could decline into the range of 1.7% to 2.3%, which is where the thirty year yields in the Japanese and German economies, respectively, currently stand.

Van R. Hoisington
Lacy H. Hunt, Ph.D.
Like Outside the Box?
 
Sign up today and get each new issue delivered free to your inbox.
It's your opportunity to get the news John Mauldin thinks matters most to your finances.


Important Disclosures


Great new video, #3 of Bill Poulos's "Portfolio Prophet" trading lab series is now ONLINE!


-->

Saturday, July 12, 2014

Weekly Crude Oil Market Recap with Mike Seery

Our trading partner Mike Seery is giving us his weekly crude oil futures market recap.....go shorty, go shorty!

Crude oil futures in the August contract are down $1.00 at 101.93 a barrel and I am currently recommending a short position as prices have hit a 4 week low while placing your stop at the 2 week high of 106.10 risking around $4,000 from today’s price levels as the commodity markets in general have turned extremely bearish as deflation is a short term concern as prices are trading below their 20 day but still above their 100 day moving average telling you the trend is mixed as the chart structure will improve on a daily basis so I remain bearish.

Problems in Iraq have basically gone on the back burner and not talked about as much as it was a couple weeks back when prices hit new highs at 107 as prices are down over $2 for the trading week with the next major support around 101 and if that level is broken I think you could trade between 96 – 98 here in the short term. Crude oil prices have rallied from $90 in January all the way up to 107 as many of the commodity markets rallied early in 2014 but that has changed in recent weeks as many of the agricultural markets have absolutely plunged as I think that will start to pressure crude oil prices also due to the fact that the Federal Reserve is cutting back on the quantitative easing which is bearish commodities.

TREND: LOWER
CHART STRUCTURE: IMPROVING

Here is more of Mike's calls on commodities this week....Just Click Here!


Get your seat for our next free webinar "Low VIX and What It Means to Your Trading"....Just Click Here!


-->

Wednesday, July 9, 2014

Using Supply and Demand to Beat the Market: An Interview with Fund Manager Charles Biderman

By Dan Steinhart, Managing Editor, The Casey Report

It’s an investing strategy so simple, you’ll wonder why you didn’t think of it. Like any other market, the stock market obeys the laws of supply and demand. Reduce supply, and prices should rise. Therefore, companies that reduce their outstanding shares by buying back their own stock should outperform the market.

That’s the basic theory that Charles Biderman, who was recently featured in Forbes and is chairman and founder of TrimTabs Investment Research, follows to manage his ETF, TrimTabs Float Shrink (TTFS).
And it works. Since its inception in October 2011, TTFS has beaten the S&P 500 by 15 percentage points. That’s no small feat, especially during a bull market. Most hedge fund managers would sacrifice their firstborns for such stellar performance.

There are, of course, nuances to the strategy, which Charles explains in an interview with Casey Research’s managing editor Dan Steinhart below. For example, companies must use their own money to buy back shares. Borrowing for buybacks is a no no.

It’s also worth mentioning, you can meet and learn all about Charles’ strategy in person. He’ll be available at  Casey Research’s Summit: Thriving in a Crisis Economy in San Antonio, TX from September 19-21 where he’ll be working with attendees to teach them how to beat the market using supply and demand analysis.

And Charles is just one of many all stars on the faculty for this summit—click here to browse the others, which include Alex Jones, Jim Rickards, and, of course, Doug Casey.

Also, you can still sign up for this Summit and meet some of the world’s brightest financial minds and receive a special early bird discount. You’ll save $400 if you sign up by July 15th. Click here to register now.
Now for the complete Charles Biderman interview. Enjoy!


Using Supply and Demand to Beat the Market: An Interview with Fund Manager Charles Biderman

Dan: Thanks for joining us today, Charles. Could you start by telling us a little bit about your unique approach to stock market research?

Charles: Sure. I’ve been following the markets for 40 years. Everybody talks about earnings and interest rates and growth rates and what the government is doing. But here’s the thing: the stock market is made up of shares of stock. That’s it. There is nothing else in the stock market.

So my firm tracks the supply and demand of the stock market. The number of shares outstanding is the supply. Money is the demand. We discovered when more money chases fewer shares, the market goes up. Isn’t that shocking?

Dan: [Laughs] Not very, when you put it that way.

Charles: Whenever I talk with individual investors, I tell them that there’s only one reason for them to listen to me: that they think I can help them beat the market. I’ve spent 40 some years looking at markets in a different way than other people. I’ve found that the market is like a casino: it has a house and players. You know the house has an edge, because if it didn’t, the stock market wouldn’t exist.

Who is the house in the stock market? Not brokers, or even high frequency traders. Companies are the house. As investors, we’re playing with their shares, and the companies know more about them than we do.
I’ve discovered that companies buy back their own shares because they think the price is heading higher. So when a company buys back its own shares using its own money, you should buy that stock too. But only if the company uses its own money. Borrowing money to buy shares is a no-no.

Conversely, when companies are growing their shares outstanding by selling stock to raise money, they don’t like where their stock price is headed. If they don’t want to own their own stock, you shouldn’t either.
My basic philosophy is to follow supply and demand of stocks and money, and you can’t go wrong.

Dan: Your theory has worked very well in practice. Your TrimTabs Float Shrink ETF (TTFS) beat the S&P 500 by an impressive 12 percentage points in 2013. And that’s really saying something, considering how well the S&P 500 performed.

Charles: Yes, and we’ve outperformed the S&P 500 over the past year as well.

Dan: What specific investment strategies did you use to generate that return?

Charles: Our fund invests in 100 companies that are growing free cash flow—which is the money left over after taxes, R & D, capital expenditures, and dividends—and using it to buy back their own shares.
We modify our holdings every month because we’ve discovered that the positive effects of buybacks only last for a short time. So when a company stops shrinking its float, we kick it out. Our turnover is about 20 stocks per month.

Dan: The supply side of the equation seems pretty straightforward. What do you use to approximate demand? Money supply numbers?

Charles: Sort of. Institutions own around 80% of the shares of the Russell 1000, so we track the money that flows through them into and out of the stock market.

We also track wage and salary growth. We’re not interested in income generated by government actions, but rather by the wages of the 137 million Americans who have jobs subject to withholding. Money for investment comes from income. People can only invest the money they have left over after they cover expenses.

Income in the U.S. is currently around $7.5 trillion per year. That’s an increase of around $300 million over last year, or a little under 3% after inflation. That’s not sufficient to generate money for investment.

However, the Fed’s zero interest rate policy has showered companies with plenty of cash to improve their operations. As a result, many industries have record high profit margins. But at the same time, most management teams are still afraid to reinvest their profits into expanding their businesses because they don’t see final consumption demand growing. So these companies have been buying back their shares instead. The total number of shares in the market has declined pretty much consistently since 2010.

An investment institution typically targets a specific percentage of cash to hold, say 5%. So when a company buys back its own stock from these institutions, the institutions now have more money and fewer shares. To meet their cash allocation target, they have to go out and buy more shares. So the end result is more money chasing fewer shares.

This is why we’ve been experiencing a “melt-up” in the market. It has nothing to do with the economy—it’s solely due to supply and demand. And as buybacks continue, stock prices will continue to rise.

The caveat is that unless the economy recovers in earnest, the gap between stock prices and the real-world economy will continue to grow. At some point, it will get too wide, and we’ll get a bang moment similar to the housing crisis, when everyone realized that housing prices were too far above their underlying value in 2007.

Dan: Do you monitor macroeconomic issues as well?

Charles: Yes, but as I like to say, all macro issues manifest as supply and demand eventually. Supply and demand is what’s happening right now. All of those other inputs get us to “now.”

Dan: I understand. So you’re more concerned with the effects of supply and demand than the causes.

Charles: Right. Price is a function of the world as it exists right now. If you don’t have cash, it doesn’t matter how fantastic stock market fundamentals look. Without cash, you can’t buy, no matter how compelling the value.

Dan: Could you share a preview of what you’ll be talking about at the Casey Research Summit in San Antonio?

Charles: I’ll be giving specific advice to individual investors on how to beat the market. Outperforming the overall market is very difficult to do, and earnings analysis and graphic analysis has never been proven to do it over a long period. Supply and demand analysis has. So I will work with attendees and show them how to apply those strategies to beat the market going forward.

Dan: Great; I look forward to that. Is there anything else you’d like to add?

Charles: The phrase “disruptive technology” is popular today. I think investing on the basis of supply and demand is a disruptive technology compared with other investing strategies, most of which have never really worked. Cheap, broad-based index funds are so popular because very few investing strategies offer any real edge. I believe supply and demand investing gives me an edge.

Dan: Thanks very much for sharing your insights today. I’m excited to hear what else you’ll have to say at our Thriving in a Crisis Economy Summit in San Antonio.

Charles: I’m looking forward to the Summit as well. I hope the aura of the San Antonio Spurs’ victory will rub off on all of us.

Dan: Me too. Thanks again.


Get your seat for our next free webinar "Low VIX and What It Means to Your Trading"....Just Click Here!


Monday, July 7, 2014

Gold Option Trade – Will Gold Continue to Consolidate?

Until recently, the world has forgotten about gold and gold futures prices it would seem. A few years ago, all we heard about was gold and silver futures making new highs on the back of the Federal Reserve’s constant money printing schemes.

However, after a dramatic sell off the world of precious metals it became very quiet.


Gold prices have been in a giant basing or consolidation pattern for more than one year. As can clearly be seen below, gold futures prices have traded in a range between roughly 1,175 and 1,430 since June of 2013.


Chart1


The past few weeks we have heard more about gold prices as we have seen a five week rally since late May. I would also draw your attention to the fact that gold futures also made a slightly higher low which is typically a bullish signal.


At this point in time, it appears quite likely that a possible test of the upper end of the channel is possible in the next few weeks / months. If price can push above 1,430 on the spot gold futures price a breakout could transpire that could see $150 or more added to the spot gold price.


Clearly there are a variety of ways that a trader could consider higher prices in gold futures. However, a basic option strategy can pay handsome rewards that will profit from a continued consolidation. The trade strategy is profitable as long as price stays within a range for a specified period of time. Ultimately this type of trade strategy involves the use of options and capitalizes on the passage of time.


The strategy is called an Iron Condor Strategy, however in order to make this trade worth while we would consider widening out the strikes to increase our profitability while simultaneously increasing our overall risk per spread. Consider the chart of GLD below which has highlighted the price range that would be profitable to the August monthly option expiration on August 15th.


Chart2


As long as price stays in the range shown above, the GLD August Iron Condor Spread would be profitable. Clearly this strategy involves patience and the expectation that gold prices will continue to consolidate. This trade has the profit potential of $37 per spread, or a total potential return based on maximum possible risk of 13.62%. The probability based on today's implied volatility in GLD options for this spread to be profitable at expiration (August 15) is roughly 80%.


Our new option service specializes in identifying these types of consolidation setups and helps investors capitalize on consolidating chart patterns, volatility collapse, and profiting from the passage of time. And if you Advanced options trades are not your thing, we also provide Simple options where we buy either a call or put option based on the SP500 and VIX. The nice thing about buying calls and puts is that you can trade with an account as little as $2,500.


If You Want Daily Options Trades, Join the Technical Traders Options Alerts

See you in the markets!

Chris Vermeulen

Sign up for our next free trading webinar "Low VIX and What It Means to Your Trading"


Friday, July 4, 2014

Low VIX and What It Means to Your Trading....Our Next Free Webinar

You are invited to attend our next free webinar, presented by former CBOE floor trader Dan Passarelli on Tuesday July 15th at 4:30 EDT. Dan's focus for this webinar will be "Low VIX and What It Means to Your Trading".

Many traders are having a tough time making money in this market. Why? Low VIX. Professional traders use the VIX as a guide to gauge potential option profits. Attend this webinar with Dan and learn what the VIX is telling us about your trading this summer.

Don't miss this special webinar.

Just click here to reserve your seat now

See you Tuesday July 15th!

Ray @ The Crude Oil Trader

Our next free webinar "Low VIX and What It Means to Your Trading"....Just Click Here!


Tuesday, July 1, 2014

5 Simple Rules to Evolve Past the Hot Stock List

By Andrey Dashkov

If you’re a typical small time investor, chances are you prefer to let a team of analysts fuss about such irksome things as correlation and beta. Maybe you’ve bought a stock because your brother in law gave you a hot tip, maybe you heard something about it on a financial news show, or maybe you just loved the company’s product.


Friends often ask me for “hot stock tips”—which is like walking up to someone at the craps table and asking what number to bet on. An accomplished craps player will have position limits, stop losses, income targets, and an overall strategy that does not hinge on one roll of the dice. You need an overall strategy long before you put money down.

So, what do I tell those friends asking for hot stock tips? Well, that they can retire rich with a 50-20-30 portfolio:
  • Stocks. 50% in solid, diversified stocks providing healthy dividends and appreciation.
  • High Yield. 20% in high yield, dividend paying investments coupled with appropriate safety measures. These holdings are bought for yield; any appreciation is a nice bonus.
  • Stable Income. 30% in conservative, stable income vehicles.
Unless you’re starting entirely from scratch, you should review your current portfolio allocations, identify where you’re over or underallocated, and then look for investments to fill those holes. In our portfolio here at Miller's Money Forever, we separate our recommendations into StocksHigh Yield, and Stable Income to help you do just that.

The Art of the Pick


By the time an investment lands in our portfolio, we’ve already run it through our Five Point Balancing Test. When your boasting brother in law tempts you with a “can’t-miss opportunity” or some pundit touts a hot tech company on television, you can come back to these five points, again and again.
  1. Is it a solid company or investment vehicle? Investing your retirement money safely is a must. How do you know if a company is solid? Take the time to validate essential company information, particularly when the recommendation comes from a source with questionable motivation.
  2. Does it provide good income? A good stock combines a robust dividend and appreciation potential.
  3. Is there a good chance for appreciation? There are two types of appreciating stocks: those that rise because of general market conditions and those that rise further because of the way management runs the business. We want both.
  4. Does it protect against inflation? High inflation is one of the biggest enemies of a retirement portfolio.
  5. Is it easily reversible? Ask yourself, “Can I quickly and easily reverse this investment if something unexpected occurs?” The ability to liquidate inexpensively is critical to correcting errors.

Marking the Bull’s Eye So You Can Hit It


It’s worthwhile to write down your goal—including an income target and the price at which you’ll sell if things head south—with every investment. After all, if you can’t see the bull’s eye, how will you know if you’ve hit it? Buying any investment because a trusted adviser, newsletter, or pundit recommended it is not a good enough reason. Buying because your portfolio has a hole, you understand the company, the investment vehicle, the risks, and the potential is.

Remember, retiring rich means having enough money to enjoy your lifestyle without money worries. Do your homework on every investment and you’ll make that pleasant thought your life’s reality. Every week, the Miller’s Money team provides no nonsense, practical advice about the best ways to invest for your retirement in  Miller’s Money Weekly Sign up here to receive it every Thursday.

The article 5 Simple Rules to Evolve Past the Hot-Stock List was originally published at Millers Money


Get your seat for our next free webinar "Low VIX and What It Means to Your Trading"....Just Click Here!


Monday, June 30, 2014

Minimum Wage, Maximum Stupidity

By Doug French, Contributing Editor

The minimum wage should be the easiest issue to understand for the economically savvy. If the government arbitrarily sets a floor for wages above that set by the market, jobs will be lost. Even the Congressional Budget Office admits that 500,000 jobs would be lost with a $10.10 federal minimum wage. Who knows how high the real number would be?

Yet here we go again with the “Raise the minimum wage” talk at a time when unemployment is still devastating much of the country. The number of Americans jobless for 27 weeks or more is still 3.37 million. And while that’s only half the 6.8 million that were long term unemployed in 2010, most of the other half didn’t find work. Four fifths of them just gave up.

So, good economics and better sense would say, “make employment cheaper.” More of anything is demanded if the price goes down. That would mean lowering the minimum wage and undoing a number of cumbersome employment regulations that drive up the cost of jobs.

But then as H.L. Mencken reminded us years ago, “Nobody ever went broke underestimating the intelligence of the American public.” Which means the illogical case made by Republican multimillionaire businessman Ron Unz is being taken seriously.

We Don’t Want No Stinkin’ Entry Level Jobs


Unz says the minimum should be $12 and recognizes that 90% of the resistance is that it would kill jobs. So what’s his answer to that silver bullet to his argument? America doesn’t want those low paying jobs anyway. In his words, “Critics of a rise in the minimum wage argue that jobs would be destroyed, and in some cases they are probably correct. But many of those threatened jobs are exactly the ones that should have no place in an affluent, developed society like the United States, which should not attempt to compete with Mexico or India in low wage industries.”

He doesn’t think much of fast food jobs either. But he knows that employment can’t be shipped overseas, so Mr. Unz’s plan for those jobs is as follows:

So long as federal law requires all competing businesses to raise wages in unison, much of this cost could be covered by a small one time rise in prices. Since the working poor would see their annual incomes rise by 30 or 40 percent, they could easily afford to pay an extra dime for a McDonald’s hamburger, while such higher prices would be completely negligible to America’s more affluent elements.

The Number of Jobs Isn’t Fixed


He believes that if all jobs pay well enough, legal applicants will apply and take all the jobs. This is where Unz crosses paths with David Brat, the economics professor who recently unseated House Majority Leader Eric Cantor.

Brat claims to be a free-market sympathizer and says plenty of good things. However, in his stump speeches and interviews, Brat says early and often, “An open border is both a national security threat and an economic threat that our country cannot ignore. … Adding millions of workers to the labor market will force wages to fall and jobs to be lost.”

That would make sense if there were a fixed number of jobs, but that’s not the case. An economics professor should know that humans have unlimited wants and limited means, which, as Nicholas Freiling explains in The Freeman, “renders the amount of needed labor virtually endless—constrained only by the economy’s productive capacity (which, coincidentally, only grows as the supply of labor increases).”

An influx of illegal immigrants may or may not drive down wages, but even if it does, that’s a good thing. Low wages allow employers to invest in other things. More efficient production lowers costs for everyone, producers and consumers, allowing for capital creation. In the long run, it is capital investment that creates jobs.

Employers Bid for Labor Like Anything Else


Mr. Unz claims that low-wage employers are being subsidized by the welfare state. “It’s a classic case of where businesses manage to privatize the benefits of their workers—they get the work—and socialize the costs. They’ve shifted the costs over to the taxpayer and the government,” writes Unz.

It makes one wonder how the businessman made millions in the first place. Wage rates aren’t determined by what the employee’s expenses are. “Labor is a scarce factor of production,” wrote economist Ludwig von Mises. “As such it is sold and bought on the market. The price paid for labor is included in the price allowed for the product or the services if the performer of the work is the seller of the product or the services.”

Mises explained that a general rate of wages does not exist. “Labor is very different in quality,” Mises wrote, “and each kind of labor renders specific services. each is appraised as a complementary factor for turning out definite consumers’ goods and services.”

Not every job contributes $12 an hour in production benefits toward a finished good or service. And many unskilled laborers can’t generate $12 an hour worth of output. The Congress that created the minimum wage knew this and carved out the 14(c) permit provision in the Fair Labor Standards Act of 1938, allowing an exemption from minimum wage requirements for businesses hiring the handicapped.

That Congress included in the act this language:

The Secretary, to the extent necessary to prevent curtailment of opportunities for employment, shall by regulation or order provide for the employment, under special certificates, of individuals ... whose earning or productive capacity is impaired by age, physical or mental deficiency, or injury, at wages which are lower than the minimum wage.

Entrepreneurs must purchase all factors of production at the lowest prices possible. No offense to labor—that’s what customers demand. All cuts in wages pass through to customers. If a business pays more than the market wage rate, the business “would be soon removed from his entrepreneurial position.” Pay less than the market, and employees leave to work somewhere else.

Who Picks Up The Tab?


First, Unz says, “American businesses can certainly afford to provide better pay given that corporate profits have reached an all-time high while wages have fallen to their lowest share of national GDP in history.” So, instead of taxpayers supporting the poor, Unz wants business to pay. No, wait: later he writes that consumers will support the poor by paying higher prices.

“McDonald’s and fast food places would probably have to raise their prices by 8 or 9 percent, something like that. Agricultural products that are American-grown would go up by less than 2 percent on the grocery shelves. And those sorts of price increases are so small that they would be almost unnoticed in most cases by the consumer.” Walmart would cover a $12 minimum wage with a one time price increase of 1.1%, he says, with the average Walmart shopper paying just an extra $12.50 a year. So it’s consumers—who are also taxpayers—who get to be their brother’s keeper either which way with Unz’s plan.

Walmart Must Be Offering Enough


Fortune magazine writer Stephen Gandel appeared on Morning Joe this week, making the case that Walmart should give its employees a 50% raise (his article in Fortune on the subject appeared last November). According to him, the company is misallocating capital by not paying higher wages. He says investors are not giving the company credit for the lower pay in the stock price, so they should just do the right thing and pay their employees more.

But Walmart does pay more when it has to compete for employees. In oil rich Williston, North Dakota, the retail giant is offering to pay entry level workers as much as $17.40 per hour to attract employees.
Walmart isn’t alone. McDonald’s is paying $300 signing bonuses to attract workers. The night shift at gas stations in Williston pays $14 an hour.

By the way, whatever Walmart is paying, it must be enough, because it has plenty of applicants to choose from. In 2005, 11,000 people in the Bay Area applied for 400 positions at a new Oakland store. Three years later near Chicago, 25,000 people applied for 325 positions at a new store.

Last year a new Walmart opened in the DC area. Again, the response was overwhelming. Debbie Thomas told the Washington Post, “It’s hard to live in this city on $7.45 or $8.25 an hour. I’ve lived here all my life, and I want to stay here. In the end, I’m just glad Walmart’s here. I might get a job.”

Throughout history, people have had to relocate to find work. Today is no different.

In the long run, as the minimum wage increases, capital will be invested to replace labor. We’ve seen it for years. Machines don’t call in sick, sue for harassment, require health insurance, or show up late. Now patrons pour their own drinks. Shoppers scan their own groceries and pump their own gas. Soon we’ll be ordering from electronic tablets at our tables in sit down restaurants to cut down on wait staff, and the cooks will be replaced by automated burger makers.

Unz may well believe what he proposes would be doing good; however, it means kids and the unskilled go unemployed and in the end, are unemployable.

You read an excerpt from the Daily Dispatch, Casey Research’s wildly popular e-letter. Stay in the loop on big-picture trends, precious metals, energy, technology, and more. Sign up Here to receive the Daily Dispatch free of charge in your inbox.

The article Minimum Wage, Maximum Stupidity was originally published at Casey Research


Check out our "Beginner's Guide to Trading Options"....Just Click Here!


-->

Sunday, June 29, 2014

Thomas Edison’s Dream Smashed

By Adam J. Crawford, Analyst

The incandescent light bulb was invented in the very early 1800s, but at that time was a device too crude and impractical for mass adoption. Over the next 80 years, at least 20 inventors contributed to its improvement, until, in 1880, Thomas Edison developed and patented a bulb that would last a miraculous 1,200 hours. Edison’s product was the first to offer the levels of functionality, durability, and affordability necessary for widespread commercial appeal. That’s why he gets credit for inventing the light bulb, even though he was decades late to the party.


Some 130 years after Edison’s patent was approved, the incandescent light bulb has basically the same features… a filament inside a glass bulb with a screw base. And for all those years, it’s been doing yeoman-like work providing clean, quality lighting (compared to the candles and oil lanterns of the 19th century), in millions of homes and offices. Today, however, the incandescent light bulb is on its way out… and a multibillion-dollar industry will be forever changed.

Done In by Inefficiency

The incandescent bulb, though very effective, is notoriously inefficient. To understand why, one need only understand how it produces light. The filament (or wire) inside a bulb is heated by an electric current until it becomes so hot it glows.

The problem: only about 10% of the energy used by an incandescent bulb is converted into light; the rest is dissipated as usually unwanted heat.

This is a problem, not just for the homes and businesses using these bulbs, but also upstream at the power plants that produce the required energy. In an era when producers are wondering how they’re going to keep up with the surging demand amidst rising fuel costs and concern about the environmental impact of energy production is running high, such inefficiencies are frowned on.

Governments, of course, have the ability to put muscle behind their frowns… and they’re doing just that. In 2013, it became illegal in the United States to manufacture or import 75 and 100 watt incandescent bulbs. 40 and 60 watt bulbs were added to the ban in January of this year. The U.S. isn’t the only government actively limiting the use of incandescent bulbs. The European Union, Canada, Brazil, Australia, and even China are among many that have phase out programs aimed at forcing users to convert to an alternative technology.

For household applications, that primarily means a switch to those twisty shaped compact fluorescent lamps (CFLs), or the newest competition in town, light emitting diodes (LEDs).

A CFL’s spiral tube contains argon and mercury vapors, and they are far more efficient than the old Edison bulb. When an electrical current is passed through the vapors, invisible ultraviolet light is produced. The ultraviolet light is transformed into visible light when it strikes a fluorescent coating on the inside of the tube.. all at about one fourth the electrical cost for an equivalent amount of light from an incandescent lamp.

LEDs, in contrast, don’t use commonplace materials. Rather, they’re made from somewhat exotic semiconductor materials, like indium and gallium nitride. When an electrical current is passed through these semiconductors, energy is released in the form of particles called photons—the most basic units of light in physics, i.e., light’s equivalent of individual electrons. In the process, little is lost to heat and the materials take minimal wear, making for another very efficient light source, and one that lasts far longer than its competitors.

Comparing the Alternatives

Right now, LED bulbs are relatively expensive to produce. That’s because a bulb is not just a bulb when it comes to LEDs—it can’t be made brighter by just putting in a thicker filament or tube. Instead, each bulb is a complex web of up to dozens of small diodes, each roughly the size of a pinhead, wired together and to a ballast that regulates the electricity flowing through them.

When compared head to head with incandescent and CFL light bulbs, LEDs come out the clear winner in operating costs. But even with millions of these bulbs now shipping to Home Depot, they still fall down on initial cost:

60-WATT
Equivalent
Incandescent
CFL
LED
Lumen 880 800 800
Life (hours) 1,000 8,000 25,000
Initial cost $1.19 $5.00 $9.98
Yearly operating cost $7.23 $1.81 $1.45


However, when you add up those advantages over that 25,000 hour lifetime, then the advantages start to become clear:


60-WATT
Equivalent
Incandescent
CFL
LED
Yearly
operating cost
$7.23 $1.81 $1.45
Years 23 23 23
23-year
operating cost
$166.29 $41.63 $33.35
Initial cost $1.19 $5.00 $10.00
Replacement
cost
$28.56 $10.00 $0.00
Total cost $196.04 $56.63 $43.35

As you can see, to produce roughly the same lumens (a measure of the amount of visible light emitted by a source), both CFLs and LEDs are hands-down more economical than incandescent bulbs.

Of course, in a residential scenario where a bulb is run for maybe three hours a day, it would take about 23 years to realize that big a savings. But put them in place in a commercial or industrial setting like the hundreds of lights running 24 hours a day in the local Walmart, and the savings add up quickly.

Still, why are we so bullish on the prospects for LEDs if they barely edge out their CFL competitors over tens of thousands of hours?

The first difference is environmental. CFLs have the inherent disadvantage of containing mercury, a toxic metal that poses health and environmental risks. Break one of these bulbs and you have a biohazard on your hands. There’s a real cost to recycling these bulbs and containing the mess from those that are just tossed in the trash heap. It’s a cost that will certainly be shifted back to consumers of the bulbs if environmental legislation continues on its same path.

Further still, over its life, an LED bulb is already 25% more economical than a CFL. When compared to an incandescent bulb, either is a huge cost winner. But when it comes down to dollars and cents, the LED wins today. The only reason not go that route is the big upfront cost difference, which when buying tens of thousands of bulbs at a time (as many commercial companies do) can be a hard pill to swallow.

However, the cost of LEDs has been falling fast in recent years and will continue to do so. In 2011, a 60 watt equivalent LED bulb retailed for about $40. In 2012, the price fell below $20. Today, it’s less than $10.

As volumes increase and competition among manufacturers and retailers intensifies, prices will continue to fall. Some industry analysts see a $5 LED on the near horizon. We wouldn’t bet against it.

The price could go even lower if manufacturers can successfully implement a cost-reduction break through. Specifically, LED devices are built on expensive aluminum oxide substrates. But manufacturers are working on ways to build on substrates made of silicon, which would substantially reduce defects and thus costs. As prices drop, and if environmental law hits mercury laced CFLs next, LED’s cost advantage will start to widen significantly.

Inflection Point

This all means that the LED’s time has arrived. According to IHS, a global market and economic research firm, unit shipments of LED lighting devices will grow at a compounded annual rate of 40% between now and 2020.


In 2011, the size of the global lighting market was about $96 billion, and LED devices accounted for about 12% of that amount. By 2020, McKinsey & Company projects, the size of the market will be $136 billion, of which 63% will be attributable to LEDs.

With the LED bulb, we have a trend that’s been in the making for several years… and it’s now ready to surge. How should an investor play it? Certainly not with a blindfold and a dartboard, or a whole sector buy like an ETF, because not all participants in this market will prosper.

Some will not be a pure enough play to benefit, or will be cannibalizing their own incandescent and CFL business… like GE and Phillips. Others will find themselves producing a commodity with ever thinning margins… like Cree. And others still already have much of the anticipated growth priced into their shares.
However, we scanned the field and found a company that is well positioned to benefit from the growth of the LED market while, at the same time, actually improving its margins.

We believe this company’s stock is undervalued. That’s why we’re recommending it in the next issue of BIG TECH

For access to this recommendation and many more, simply sign up for a risk free trial of BIG TECH. 

If you decide to keep your subscription, it will only cost a mere $99, nothing compared to the profits just this one investment should bring. But, if for any reason you’re unsatisfied, simply cancel to receive a prompt, courteous, and complete refund of the entire subscription price. You have 3 full months to make up your mind.

The article Thomas Edison’s Dream Smashed was originally published at Casey Research


Check out our "Beginner's Guide to Trading Options"....Just Click Here!


Stock & ETF Trading Signals