Showing posts with label investing. Show all posts

Friday, February 17, 2023

Are You Ready For When Opportunity Knocks? Sprott PM Projections


Chris sits down with Craig Hemke of Sprott Money to talk about current opportunities and where the market may go next through the lens of technical analysis. By focussing on the price charts only, all additional news based noise falls away, and a clearer picture emerges about where an opportunity to invest exists....Continue Reading Here.

Monday, January 30, 2023

Is A Full Fledged Bear Market On The Horizon and The Rally In Precious Metals?

Chris Vermeulen sits down with David Lin of Kitco News to discuss the current market and asset class cycles – a very important concept to understand when positioning investments. Looking at the stages of the market and the emotions of investors and trades, the question comes up of whether we are about to start a new bull market or are hovering on the edge of a complacency phase, about to tip into a full-fledged bear market....Continue Reading Here.

Thursday, January 12, 2023

Monthly Outlook For Precious Metals Super Cycle - Today’s Free Video

Chris Vermeulen discusses the current state of various markets, including the stock market, and suggests that there may be a bear market on the horizon. 

He also discusses the potential for a “supercycle” in precious metals, specifically gold and silver, and suggests that there may be opportunities for investment in these areas....Watch Video Here.


Thursday, December 22, 2022

Why Gold And Oil Falling In Value Are A Bad Sign For 2023

In the past two weeks, stocks have struggled to break through resistance and extend the holiday rally. I wrote about it in the post Stock Indexes Rejected At Resistance Signal Another Correction. But what is a more bearish sign is seeing commodity prices starting to fall. There are a couple of reasons this is a warning signal for traders and investors, and I will show you exactly what they are....Continue Reading Here.


Friday, December 16, 2022

Stock Indexes Rejected At Resistance Signal Another Correction

Stocks struggled with overhead resistance for the past week. While seasonal trends usually favor a year end rally, this year’s rally may already have finished. January will be the month to watch. If the market closes with a positive January, we almost always have a strong year for stocks. 

But if not, we could be in for a doozy of a bear market in the first half of 2023. This week we had more hawkish Fed talk on Wednesday, suggesting that rates will remain higher for a longer period of time....Continue Reading Here.

Monday, November 28, 2022

After This Holiday Rally, You Better Know When To Walk Away

This week’s investor insight will make you think twice about the current stock and bond rally as we head into the end of the year.

We get a lot of questions about if the stock market has bottomed or if it is headed lower and how they can take advantage of the next Major market move. Over the next 6 to 12 months, I expect the market to have violent price swings that will either make or break your financial future. So let me show a handful of charts and show what I expect to unfold.

Let’s dive in....Continue Reading Here.

Tuesday, August 30, 2022

New Gold Apex Pattern - How Will The U.S. Fed Rate Decision Affect This?

My research shows a new Gold Apex pattern is set up for September 11th - 15th. Around September 11th or after, Gold will attempt to reach this new Apex level near $1766. This price pattern is important because the US Fed rate decision date is September 20th - 21st, and a host of economic data reporting comes out the week before the Fed decision.

My educated guess is Gold & Silver will begin a volatile breakout move, possibly rolling lower to retest support near $1672, before attempting to move higher as global fear starts to elevate. I believe the current lower support level is critical to understanding the opportunities in Gold. If the $1672 level is breached to the downside, it means that Gold has lost a critical support level and will likely trend lower....Continue Reading Here.

Thursday, August 18, 2022

Crude Oil Prices - Will They Hold Above Key Support Level Or Begin To Unwind?

Talk of a global recession may prompt a broad decline in crude oil prices as the excesses of the past 10+ years unwind. This unwinding process pushed to the forefront for traders and investors has been prompted by a massive inflationary expansion after the COVID-19 lock downs. How will it play out in the short term and long term?

We believe crude oil will contract as the initial reduction in demand associated with high priced gasoline and oil products and the threat of a global recession recede. This decline in crude oil prices is complicated as China/Asia economic and COVID crisis events continue to disrupt consumer discretionary income and asset valuation levels.....Continue Reading Here.


Thursday, June 23, 2022

Crude Oil Breaks Downward – Rejecting The $120 Price Level

The recent downward Crude Oil trend may have caught many traders by surprise. Just before the US Fed raised interest rates on June 15, 2022, Crude oil was trading above $120ppb. Less than 5 days later, it collapsed -12% and has continued to trend lower. Currently, Crude Oil is near -17% lower than recent highs.

It appears Crude Oil has confirmed resistance near $120 and is devaluing as consumers pull away from traditional driving/spending habits while the Fed aggressively attempts to burst the inflation bubble. This type of contraction in Crude Oil is very similar to what happened in 2008-09 when the Global Financial Crisis (GFC) hit – Crude Oil collapsed more than -70% after IYC started trending lower in 2007....Continue Reading Here

Saturday, May 14, 2022

Trading Crude Oil With USO

Crude oil, like most commodities, is not priced as a single data point like a stock. Instead, commodities, like oil, trade via futures contracts. A futures contract is an agreement to buy or sell a particular commodity or security at a predetermined price at a specified time in the future. Futures contracts are standardized for quantity and quality specifications to facilitate trading on a futures exchange....Continue Reading Here.

Tuesday, April 12, 2022

Utilities Rising & Transporters Sinking - Sector Rotation Is Providing Clues

Historically, investors gravitate toward more defensive and commodity focused sectors, such as precious metals, energy, commodities, and utilities, in late cycle bull markets. Recently, the stock market is beginning to show us signs that the bull market may be coming to an end. 

Commodities such as energy, grains, and precious metals have all experienced nice rallies. Price action also confirms money flow coming out of transports and into utilities....Continue Reading Here.

Tuesday, April 5, 2022

Waiting For GLD To Make New Highs - Gold Rally Is Still Intact

The calm of the last 3 weeks has resulted in a risk on environment. This, in turn, has led to a nice recovery rally in stocks. For the time being, volatility has subsided. However, we believe there are many underlying market risks that can still resurface without any warning.

From late 2015 to August 2020, the price of gold doubled, going from approximately $1040 to $2080. Gold then experienced a profit taking $400 pullback. Gold’s rally over the past 12 months failed to break through its $2080 price level. After retreating back to $200, gold seems to have found support at the $1900 level.

In reviewing the following spot gold chart, it appears we have broken out of an accumulation phase and seem to be preparing to move above the $2080 high.....Continue Reading Here.

Thursday, March 10, 2022

How You Can Minimize Trading Risk & Grow Capital During A Global Crisis

To minimize trading risk and grow capital during a global crisis is somewhat hinged on the answers to speculative questions. 
  • How long will the Russia – Ukraine war last? 
  • How high is the price of oil and gas going to go? 
  • How quickly will central banks raise interest rates to counter high inflation? 
  • What assets should I put my money into? 
Knowing what the Best Asset Now (BAN) is, is critical for risk management and consistent growth no matter the market condition. Buy the Dip or Sell the Rally? Let's start here with the DJI weekly chart

Tuesday, February 15, 2022

Stocks Fall as Gold and Oil Jumps Amid Tension Over Ukraine - FED

The FED has made it very clear that it will raise its benchmark interest rate, the federal funds rate. This could have severe consequences and even lead to a financial crisis. They are too far behind the curve and will be labeled a major policy error in the future, most likely. They have put themselves in a situation where they are now their own hostage. They need more leadership to describe what a soft landing is going to look like. They have been too slow to act, and now they are going too fast. The “Powell Put” has now been put out to pasture.

We believe that the FED will make more rate hikes than they have announced. Goldman Sachs thinks there will be four 25-basis-point increases in the federal funds rate in 2022. Jamie Dimon, CEO of JPMorgan Chase, said, “he wouldn’t be surprised if there were even more interest rate hikes than that in 2022. There’s a pretty good chance there will be more than four. There could be six or seven. I grew up in a world where Paul Volcker raised his rates 200 basis points on a Saturday night.”

Mr. James Bullard of the St. Louis FED spoke out in an arrogant tone that aggressive action is now required. The markets translated this to mean that the FED was going to call an emergency meeting as soon as this coming week to hike interest rates by no less than 50 basis points. This sent interest rates soaring and stock prices plummeting.....Read More Here


Saturday, January 29, 2022

Fed Comments Help To Settle Global Market Expectations

The recent Fed comments should have helped settle the global market expectations related to if and when the Fed will start raising rates and/or taking further steps to curb inflation trends. 

Additionally, the Fed has been telegraphing its intentions very clearly over the past few months, providing ample time for traders and investors to alter their approach to pending monetary tightening actions. Read the full Fed Statement here.

In my opinion, foreign markets are more likely to see increased risks and declining price trends for two reasons. 

First, at risk nations/borrowers struggle to reduce debt levels. 

Second, foreign market traders/investors struggle to adapt to the transition away from speculative “growth” trends. 

I think the U.S. Dollar may continue to show strength over the next 4+ months as the foreign traders pile into U.S. economic strength while the Fed initiates their tightening actions.

So it makes sense to me that global markets would recoil from Fed tightening while debt-heavy corporations/nations seek relief from rising debt obligations....Continue Reading Here.


Thursday, December 16, 2021

Earn Monthly Dividends By Solar Powering Schools, Businesses and Communities

Like the big oil companies we are diversified across all of the energy sectors. Here is our new favorite, shore up your retirement with this great program.

Join the Sun Exchange today and start generating and selling clean energy online through a global solar cell leasing platform. All from anywhere on the planet.

Sourcing our Solar Projects
Sun Exchange identifies schools, businesses and organisations that want to go solar. Our solar engineers work with local solar construction partners to carefully evaluate proposed solar projects and ensure they meet our core criteria:

* Economic and technical viability
* Social and environmental responsibility

Tip: Sign Up and get notified about new solar project crowd sales coming soon. 

View Upcoming Solar Projects Here

Buying Solar Cells
Once solar projects have been accepted as viable and responsible, we run a crowd sale for the solar cells that will power the project. Any individual or organisation, anywhere in the world, can sign up to be a Sun Exchange member and buy solar cells, even starting with a single solar cell.

Your solar cells will:

* Generate clean energy
* Make a positive social and environmental impact
* Earn income as you lease them to schools, businesses and other organisations
* Reduce your carbon footprint for years to come

  Tip: Buy solar cells in the local currency of the project using credit card, bank transfer, Sun Exchange  
   wallet or Bitcoin (BTC).


Installing Solar Cells
Once a solar cell crowd sale sells out (they go quickly!), installation of the solar project begins. The appointed local construction partners install your solar cells, which typically takes four to six weeks, but can be longer for larger projects.

Tip: Track the status of your solar cells through your Sun Exchange dashboard.

Effortless Solar Income
Generate and sell clean energy. Schools, businesses and organisations pay you to use the clean electricity your solar cells produce. Your lease starts when your solar cells start generating electricity.

You’ll receive your monthly solar income, net of insurance and servicing fees, into your Sun Exchange wallet in your choice of the local currency of the project or Bitcoin (BTC).

Your Sun Exchange dashboard keeps you up to date on:

* Solar project status updates
* Our solar cell earnings (BTC and ZAR)
* The clean energy your solar cells generate (kWh)
* The amount of carbon your solar cells offset (kg CO2)
* Your Sun Exchange wallet balance, payments and withdrawals

  Tip: The monthly income you accumulate in your Sun Exchange wallet can be used to buy more solar cells
   in other solar projects.

Start earning monetized sunshine and offset your carbon footprint, while powering schools, businesses and communities through Sun Exchange.


Thursday, November 18, 2021

Screening Key Technicals To Select Option Trade Types

Controlling portfolio beta, which measures overall systemic risk of a portfolio compared to the market, on the whole, is essential as these markets continue to break record high after record high with violent pullbacks. 

The month of September was a prime example as the markets pushed to new all time highs early in the month then suffered a deep sell off to only bounce back to new record highs in October. 

Controlling beta while generating in line or superior returns relative to the market is the goal with an options based portfolio. A beta controlled portfolio can be achieved via a blended options based approach where ~50% cash is held in conjunction with long index based equities and an options component. 

Options alone cannot be the sole driver of portfolio appreciation; however, options can play a critical component in the overall portfolio construction to control beta....Read More Here.


Stock & ETF Trading Signals

Friday, June 4, 2021

Learn How to Take Advantage of Volatility And Profit From It

Volatility is the most common way to measure risk in the financial markets. While there are a plethora of methods, calculations, and derivatives to calculate volatility, they are all trying to accomplish the same goal: what is the price of a security going to do in the future? Without a crystal ball, there’s no perfect answer, but let’s go through a few common ways that we can estimate future volatility.

Let’s Talk Volatility

Generally speaking, there are two types of volatility that traders and investors use in an effort to understand risk – historical volatility and implied volatility....Continue Reading Here.
 

Stock & ETF Trading Signals

Sunday, May 2, 2021

Utilities Continues To Rally – Is It Sending A Warning Signal Yet?

We have experienced an incredible rally in many sectors over the past 5+ months. My research team has been pouring over the charts trying to identify how the next few weeks and months may play out in terms of continued trending or risks of some price volatility setting up. We believe the Utilities Sector may hold the key to understanding how and when the US markets will reach some level of stronger resistance as many sector ETFs are trading in new all time high price ranges.

Utilities Sector Resistance at $71.10 Should Not Be Ignored

The Utilities Sector has continued to rally since setting up a unique bottom in late February 2021. A recent double top setup, near $68, suggests resistance exists just above current trading levels. Any continuation of this uptrend over the next few weeks, targeting the $70 Fibonacci 100% Measured Move, would place the XLU price just below the previous pre COVID19 highs near $71.10 (the MAGENTA Line).

My research suggests the momentum up this recent uptrend may continue to push prices higher into early May, quite possibly setting up the Utilities ETF for a rally above $70. Yet, we believe the resistance near $71.10 will likely act as a strong barrier for price and may prompt a downward price correction after the completion of the Fibonacci 100% Measured Price Move. In other words, the recent rally across many sectors will likely continue for a bit longer before key resistance levels begin to push many sectors into some sideways trading ranges....Continue Reading Here.

Monday, April 12, 2021

Latest Price Targets for Gold, Silver and Platinum

Join Chris Vermeulen as he provides an overview, chart patterns, and projected trends for the gold, silver, and platinum markets for the upcoming quarter.

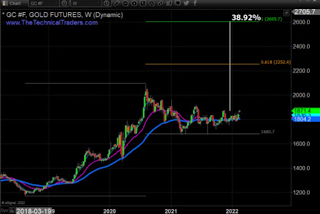
Patterns always repeat. Sometimes they take months or years but they always repeat. Gold’s 8 months consolidation is nothing new when we look at 2008 where we lost 34% before bouncing off the .382 and .5 Fibonacci retracement area between $741-$650. 

We then found its next resistance at the .618 ext around $1153 before it began to scream higher to the 1 ext at over $1900 an ounce. As Rick Rule President and CEO of Sprott says, “if past is prologue” and we pull back to the same fib level as 2008, we are there right now or could go as low as $1560. But how high will it go?

Silver blasted out of its multi-year basing formation last year to around $30 an ounce before falling to a low around $22, between the .382 and .5 Fibonacci extensions. We have strong support between $20 and $21, but it is still in a strong bull flag pattern. Where will this bull flag pattern take us?

Not as many people are interested in Platinum as it has been pretty dormant after crashing in 2008, when it was at a premium to gold. The chart looks very different from Gold with more of a “random” feel. Platinum just tested its recent high in 2016 around $1200 an ounce which is bullish, however it still has a long way to go before it tests support like gold around the .382/.5 Fibonacci retracement levels.

Overall, we never know if gold, silver, platinum, or palladium will go ballistic first so it can be a good strategy to own a basket of all of them in a balanced, diversified portfolio....Read More Here.

Stock & ETF Trading Signals