Today we asked this question of our trading partner at INO.com, Mike Seery. When Do You Enter A Trade? And what are your rules to initiate a trade on the long or short side of the commodity market? And here's what he told us.....
I have been asked this question many times throughout my career and my opinion is simply to buy on a 20-25 day high breakout in price on a closing basis only or sell on a 20-25 day low breakout to the downside also on a closing basis. Many times the price will break the 25 day high and sell off later in the day only to have your trade be negative very quickly. I would rather buy the commodity at a higher price on the close because that gives me more confidence that the market has truly broken out. However there are more ways to skin a cat and this is not the only answer because some other trading systems might rely on different breakout rules that have also been reliable. Remember always keeping a 1%-2% risk loss on any given trade therefore minimizing risks because the entry system I use always goes with the trend because I have learned over the course of time the trend is truly your friend in the long run. I also look for tight chart structure meaning a tight trading range over a period of time with relatively low volatility. I try to stay away from a crazy market that hit a 25 day high in 2 trading sessions versus the 25 high that actually took 25 days to create.
So When do You Exit a Trade?
The biggest question that I have been asked is when do I exit a winning trade and when do I exit a losing trade? In my opinion the rule of thumb that I use is placing my stop loss at the 10 day high if I’m short or a 10 day low if I’m long. The other rule of thumb is to place your stop loss at the 2% maximum loss allowed in your account for any given trade.
Check out Mike's most recent call on commodities at INO/MarketClub
Make sure you watch this weeks video "What the Market Makers Don't Want You to Know"....Just Click Here!
Showing posts with label chart. Show all posts
Showing posts with label chart. Show all posts
Saturday, September 6, 2014
Saturday, May 10, 2014
Commodities Market Recap and this Weeks Stops and Trading Numbers....Crude Oil, Natural Gas, Gold, Silver, Coffee, Sugar and More!

Crude oil futures are trading below their 20 day but still above their 100 day moving average stating that the trend is mixed as I am currently sitting on the sidelines as there is no trend currently. The fundamentals are bearish in oil as stock piles are at 85 year highs as prices peaked at 104 last month now looking at support between 97-98 dollars a barrel as I think lower prices are ahead however I am not currently participating in this market so wait for better chart structure to develop.
TREND: MIXED
CHART STRUCTURE: OK
Get our "Advanced Crude Oil Study – 15 Minute Range"
Natural Gas Futures. I had been recommending a long position in the June natural gas as prices broke down yesterday hitting a 10 day low and stopping us out of the market for a loss so sit on the sidelines and wait for better chart structure to develop. This was a disappointing trade as I thought prices were going to break above 5.00 but that did not happen so it’s time to lick your wounds and find a better trend.
TREND: MIXED
CHART STRUCTURE: SOLID
Gold futures in the June contract settled last Friday at 1,309 while going out today around 1,290 down by about $20 for the trading week as the Ukrainian situation has stalled sending gold prices back down into the recent trading range. Gold futures are trading below their 20 but right at their 100 day moving average as prices have been consolidating in the last 5 weeks trading in a $30 range as I’ve been sitting on the sidelines waiting for a better chart pattern to develop but if you are looking to get into this market on the long side I would buy at today’s prices placing my stop at the 10 day low of 1,365 risking around $2,500 per contract and if you’re looking to get short this market I would sell at today’s price while putting my stop loss at 1,310 risking around $2,000 as the chart structure is relatively tight at the current time. Gold prices rallied from 1,180 all the way up near $1,400 an ounce 2 months ago so this is basically the 50% retracement and I think you will see a consolidation for quite some time so keep a close eye on this chart as it appears to me that a breakout is looming.
TREND: MIXED
CHART STRUCTURE: EXCELLENT
Is it Time to Admit That Gold Peaked in 2011?
Silver futures in New York continued their bearish trend this week settling last Friday at 19.55 finishing lower by about $.45 for the trading week as I still think there’s a possibility that a spike bottom occurred in last Fridays trade as $19 has been very difficult to break on the downside. Silver futures have come all the way from slightly above $22 in late February all the way down to today’s level and from $35 in 2013 so this is been a bear market for well over 1 year as there seems to be a lack of interest, however eventually silver will turn around and join the rest of commodities higher but at this point there’s just very little interest. Silver futures are trading below their 20 and 100 day moving average telling you that the trend is lower and as I’ve talked about many times before if you have deep pockets and you’re a longer-term investor I think prices down at these levels are relatively cheap and if prices went lower I would continue to dollar cost average as there is real demand for silver.
TREND: LOWER
CHART STRUCTURE: EXCELLENT
Here's our Critical Line in the Sand for Silver
Coffee futures in the July contract were sharply lower this week finishing down over 1150 points this Friday afternoon to close around 184.00 a pound and I’ve been recommending a long position in coffee for quite some time as we got stopped out at the 194 level today which was the 2 week low so sit on the sidelines and wait for another trend to develop as prices could possibly retest the recent lows of around 170. Coffee futures are trading below their 20 day and above their 100 day moving average as the trend is sideways to lower currently so look for another market that is in a stronger trend but keep a close eye on this market as I do think prices are limited to the downside and I would be an interested buyer around the 165 level which was hit in early April. Coffee prices broke above to new contract highs 3 weeks ago but prices have just petered out here in recent weeks as crop estimates start to come out in the next several weeks.
TREND: MIXED
CHART STRUCTURE: POOR
Check out our Coffee Traders Facebook page
Sugar futures finished the week down around 20 points trading in nonvolatile action as prices are testing support at 17.07 settling this Friday at 17.20 and if that level is broken then I would place my stop loss above the 10 day high which stands at 18.03 risking around 100 points or $1,100 dollars per contract. The chart structure is excellent at the current time as the trend is lower as prices are trading below their 20 & 100 day moving averages as prices have been in a 100 point trading range over the last month so keep a close eye on the 17 level for a possible short as the soft commodities have turned negative recently. TREND: MIXED
CHART STRUCTURE: OUTSTANDING
Why Are So Many Boomers Working Longer?
When Do You Add To Your Winning Trade? This has always been a very interesting question because it can create a situation of going from rags to riches or from riches to rags in a very short amount of time. Many times I see traders abuse pyramiding or adding to positions with utter lack of any type of money management system in place and letting it ride which usually ends up in a complete wipeout of capital and sometimes even worse.
Commodity prices can move very quickly with large gains or loses like we experienced in the 2008 crash of stock and commodity prices, so you always have to use stops and not fall in love or marry a position. In my opinion the answer to this question is add only once to the trade if that position has made you at least 2%-3% of your account balance while still having stop losses on all positions that equal 2% loss at a maximum risk. Remember your stop loses will be different on both positions because of the fact that you entered those trades at a different date and price.
There are many different theories about how long does a meaningful consolidation have to last before you enter a trade on the breakout to the up or downside? In my opinion I always want to see a consolidation that lasts at least 8 or more weeks before I would consider entering. The reason that I want a longer consolidation is to try and avoid a bunch of false breakouts such as a 10 or 15 day consolidations which happen all the time, so I am trying to put the odds in my favor by trading the breakout of at least 8 weeks or more and the longer such as a 11 or 13 week consolidation the better. At this present time cocoa is in a major consolidation.
Want more call for this weeks commodity markets? Orange Juice, Wheat, Cotton, Cattle....Just Click Here!
Sign up for one of our Free Trading Webinars....Just Click Here!
Monday, April 21, 2014
A Crisis vs. THE Crisis: Keep Your Eye on the Ball
By Laurynas Vegys, Research Analyst
Today I want to talk about crises. Two of the most notable ones that have been in the public eye over the course of the past 6-8 months are obviously the conflicts in Ukraine and Syria. The two are very different, yet both seemed to cause rallies in the gold market.I say “seemed” because, while there were days when the headlines from either country sure looked to kick gold up a notch, there were also relevant and alarming reports from Argentina and emerging markets like China during many of the same time periods. Nevertheless, looking at the impressive gains during these periods, one has to wonder if it actually takes a calamity for gold to soar.
If so, can the yellow metal still return to and beat its prior highs, absent a major political crisis or a full blown military conflict? My answer: Who needs a new crisis when we live in an ongoing one every day?
More on this in a moment. Let’s first have a quick look at what happened in Ukraine and Syria as relates to the price of gold. Here’s a quick look at the timeline of some of the major events from the Ukrainian crisis, followed by the same for Syria.


There seems to be a fairly clear pattern in both of these charts. Gold seems to rise in the anticipation of a conflict; once the conflict gets going, or turns out not as bad as feared, however, it sells off.
We see, for example, that as the news broke that chemical weapons were being used in Syria and Obama was threatening to intervene, gold moved up. But when the U.S. did not wade into the bloodshed and Putin proposed his diplomatic solution, gold slid into a protracted sell off, ending up lower than where it began.
It’s impossible to say with any degree of certainty how much of gold’s recent rise was due to anticipation of the Ukraine/Crimea crisis, but there were certainly days when gold seemed to move sharply in response to news of escalation in the conflict. And again, after it became clear that the U.S. and EU would do little more than condemn Russia’s actions with words, gold retreated. As of this writing, it’s down about $85 from its high a little over a month ago. (We think many investors underestimate the potential impact of tit for tat sanctions, but they are not wrong to breathe a sigh of relief that a war of bullets didn’t start between East and West.)
In sum, to the degree that global crisis headlines do impact the price of gold, the effects are short lived. Unless they lead directly to consequences of long term significance, these fluctuations may capture the attention of day traders, but are little more than distractions for serious gold investors betting on the fundamentals.
You have to keep your eye on the ball.
The REAL Crisis Brewing
Major financial, economic, or political trends—the kind we like to base our speculations upon—don’t normally appear as full-fledged disasters overnight. In fact, quite the opposite; they tend to lurk, linger, and brew in stealth mode until a boiling point is finally reached, and then they erupt into full blown crises (to the surprise and detriment of the unprepared).
Fortunately, the signs are always there… for those with the courage and independence of mind to take heed.
So what are the signs telling us today—what’s the real ball we need to keep our eyes upon, if not the distracting swarm of potential black swans?
The big league trend destined for some sort of major cataclysmic endgame that will impact everyone stems from government fiscal policy: profligate spending, leading to debt crisis, leading to currency crisis, leading to a currency regime change. And not in Timbuktu—we’re talking about the coming fall of the U.S. dollar.
The first parts of this progression are already in place. Consider this long term chart of U.S. debt.

Notice that government debt was practically nonexistent halfway through the 20th century, but has seen a dramatic increase with the expansion of federal government spending.
Consider this astounding fact: The government has accumulated more debt during the Obama administration than it did from the time George Washington took office to Bill Clinton’s election in 1992. Total US government debt at the end of 2013 exceeded $16 trillion.
Let’s put that in perspective, since today’s dollars don’t buy what a nickel did a hundred years ago.

Except for the period of World War II and its immediate aftermath, never before has the U.S. government been this deep in debt. Having recently surpassed the threshold of 100% debt to GDP, America has crossed into uncharted territory, getting in line with the likes of…....
- Japan, “leading” the world with a 242% debt-to-GDP ratio
- Greece: 174%
- Italy: 133%
- Portugal: 125%
- Ireland: 117%
Granted, the politicians and bureaucrats say they will slow this runaway train, but we’re not talking about Fed tapering here. Congress will have to embrace the pain of living within its means. We’ll believe that when we see it.
But let’s take a more conservative, 10 year average growth rate (an arbitrary standard many analysts use): 5.3%. At this rate, the U.S. will still be deeper in debt than Ireland and Portugal in 2017, Italy in 2019, Greece in 2024, and Japan in 2030.
Either way, this is still THE crisis of our times; all of the countries mentioned above are undergoing excruciating economic and social pain. It’s no stretch to imagine the kind of social and political turmoil that has resulted from the European debt crisis coming to Main Street USA, as American debt goes off the charts.
It’s also important to understand that the debt charted above excludes state and local debt, as well as the unfunded liabilities of social entitlement programs like Social Security and Medicare.
This ever-growing mountain—volcano—of government debt is a long term, systemic, and extremely difficult to alter trend. Unlike the crises in Ukraine and Syria (at least, so far), it’s here to stay for the foreseeable future. While some investors have grown accustomed to this government created phenomenon and no longer regard it as dangerous as outright military conflict, make no mistake—in the mid to long term, it’s just as dangerous to your wealth and standard of living.
Still think it can’t happen here? To fully understand how stealthily a crisis can sneak up on you, watch Casey Research’s eye-opening documentary, Meltdown America.
The article A Crisis vs. THE Crisis: Keep Your Eye on the Ball was originally published at Casey Research
Sign up for one of our Free Trading Webinars....Just Click Here!
Chart of The Week - June Crude Oil Futures
As the week starts, our attention turns to the June Crude Oil futures (NYMEX:CL.M14.E). After gaining nearly $7/barrel in less than a month, the market has recently consolidated around $103.50/barrel as it begins to decide which direction it will take. It appears that some of the recent slowing of the market is due to profit taking, as the recent sharp up trend may have gained too much too soon.
There are a number of fundamental factors at play in the market, many of which seem to work in contrast with each other: support from Russia-Ukraine uncertainty, resistance from ample supply concerns, and improved demand prospects following solid U.S. Economic data last week. With a number of different fundamental factors in play – and uncertainty over which fundamental factor the market will focus on moving forward – I will focus on the technical aspects of the market for a potential trading opportunity.

Thursday’s range last week was consolidated within the previous day’s range and a move above or below that range should give us good direction to go off of. The market has started off weak this morning, and being close to $105/barrel resistance, I think that a correction off of this recent move is the more likely direction.
In the case of a move below last Thursday’s low print of 102.75, I would be a seller in this market as it will have broken this consolidation. If filled, I would place a protective stop order above Thursday’s high of $103.92. My short term target would be back down to the recent up trend line, rolling stops behind the position accordingly.
To take advantage of this move with a long term viewpoint, I would look to purchase relatively inexpensive call options and option spreads where risk on the position is limited to what you pay for the option.
Each week our trading partners at INO.com will be providing us a chart of the week as analyzed by a member of their team. We hope that you enjoy and learn from this new feature.
Sign up for one of our Free Trading Webinars....Just Click Here!
There are a number of fundamental factors at play in the market, many of which seem to work in contrast with each other: support from Russia-Ukraine uncertainty, resistance from ample supply concerns, and improved demand prospects following solid U.S. Economic data last week. With a number of different fundamental factors in play – and uncertainty over which fundamental factor the market will focus on moving forward – I will focus on the technical aspects of the market for a potential trading opportunity.
Thursday’s range last week was consolidated within the previous day’s range and a move above or below that range should give us good direction to go off of. The market has started off weak this morning, and being close to $105/barrel resistance, I think that a correction off of this recent move is the more likely direction.
In the case of a move below last Thursday’s low print of 102.75, I would be a seller in this market as it will have broken this consolidation. If filled, I would place a protective stop order above Thursday’s high of $103.92. My short term target would be back down to the recent up trend line, rolling stops behind the position accordingly.
To take advantage of this move with a long term viewpoint, I would look to purchase relatively inexpensive call options and option spreads where risk on the position is limited to what you pay for the option.
Each week our trading partners at INO.com will be providing us a chart of the week as analyzed by a member of their team. We hope that you enjoy and learn from this new feature.
Sign up for one of our Free Trading Webinars....Just Click Here!
Monday, March 31, 2014
SP500 ETF Trading Strategies & Plan of Attack for This Week
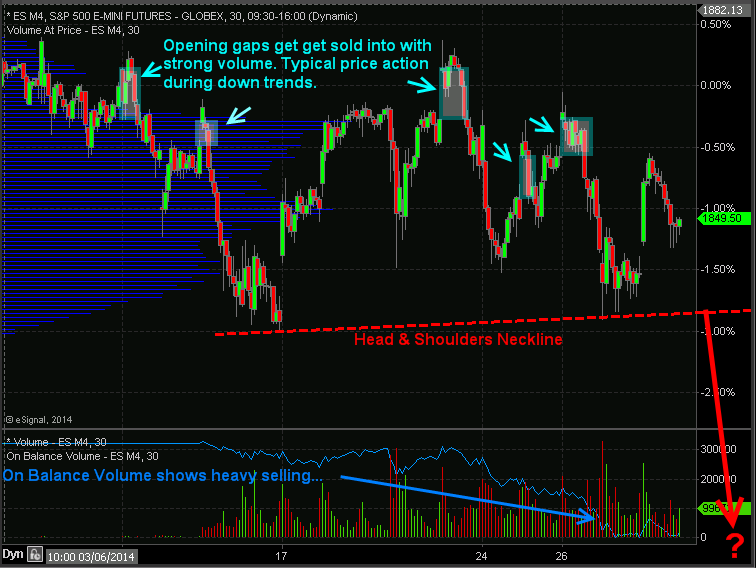
Index ETF Trading Strategies: Stocks have kick started this week with a 0.85% pop in price but the big question is if the market can hold up. Last week stocks repeatedly gap higher and sold off with strong volume telling us that institutions are slowing phasing out of stocks (distribution selling) unloading shares into strength and passing them onto the a average investor to be left holding bag.
I want to show you a couple charts which show the price action, volume and money flow of the SP500 so you have a visual of what I am talking about.
If you look at the blue on balance volume line at the bottom of the chart you can clearly see that more contracts are being sold than bought which is typically an early warning sign that the market is about to fall farther.

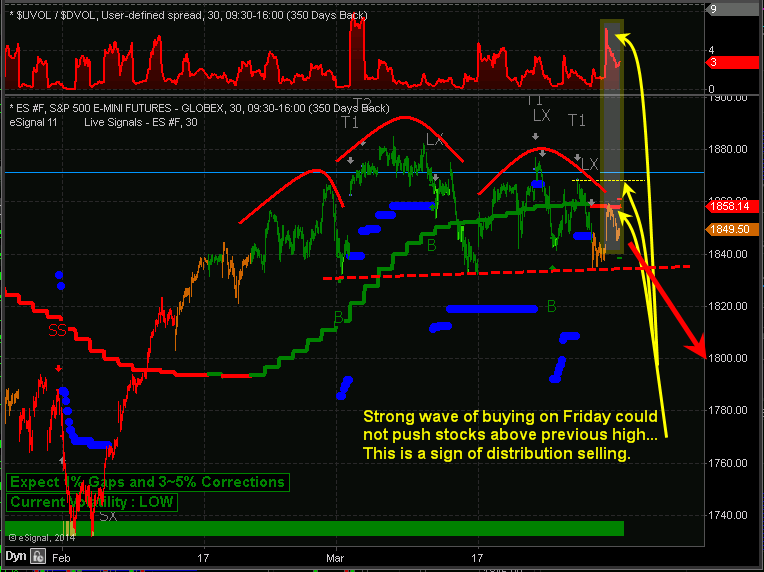
Below is a marked up screen shot of my automated trading system which I use for timing both futures and ETF trading strategies. The color coded bars tell you the market trend along with the strength of buyers and sellers.
When you couple market cycles, trends, volume/money flow, along with chart patterns we can forecast and trade markets with a high degree of accuracy in terms of market direction and timing.

My Index ETF Trading Strategies Conclusion:
Just to be clear on the current market trend and my overall outlook let me explain a little more. Overall, the broad stock market remains in an uptrend. Thursday and Friday of last week we started getting orange bars on the chart telling us that cycles, volume, and momentum are now neutral. It’s 50/50 on which way the market will go from here, so until the market internals (cycles, volume, breadth) push the odds in our favor enough for a short sell trade or a new long entry we will not add new positions to our portfolio.
It is important to understand that nearly 75% of stocks/investments move with the broad market. So we don’t want to add more long positions when the odds are not in favor of higher prices. Trading in general is not hard to do, but creating, following, executing properly money and position management is. If you have trouble with following or creating an ETF trading strategy you can have my ETF trading system for rising, falling and sideways markets traded automatically in your trading account.
Learn more here about my Automated Trading Systems
See you in the market!
Chris Vermeulen
Sign up for one of our Free Trading Webinars....Just Click Here!
I want to show you a couple charts which show the price action, volume and money flow of the SP500 so you have a visual of what I am talking about.
30 Minute Intraday SP500 Chart – ETF Trading Strategies
In the chart below you can see the price gaps followed by selling. Why is this important? It is important because during a down trend the market makers and big money plays who have the money and tools to manipulate the markets will allow the market drift higher or they will run price up in overnight or premarket trading when volume is light. Once the 9:30am ET opening bell rings volume and liquidity spike which allows the big money player to sell remaining long positions and or add to short positions they have.If you look at the blue on balance volume line at the bottom of the chart you can clearly see that more contracts are being sold than bought which is typically an early warning sign that the market is about to fall farther.
Automated Trading System – 30 Minute ES Futures Chart
Below is a marked up screen shot of my automated trading system which I use for timing both futures and ETF trading strategies. The color coded bars tell you the market trend along with the strength of buyers and sellers.
When you couple market cycles, trends, volume/money flow, along with chart patterns we can forecast and trade markets with a high degree of accuracy in terms of market direction and timing.
My Index ETF Trading Strategies Conclusion:
Just to be clear on the current market trend and my overall outlook let me explain a little more. Overall, the broad stock market remains in an uptrend. Thursday and Friday of last week we started getting orange bars on the chart telling us that cycles, volume, and momentum are now neutral. It’s 50/50 on which way the market will go from here, so until the market internals (cycles, volume, breadth) push the odds in our favor enough for a short sell trade or a new long entry we will not add new positions to our portfolio.
It is important to understand that nearly 75% of stocks/investments move with the broad market. So we don’t want to add more long positions when the odds are not in favor of higher prices. Trading in general is not hard to do, but creating, following, executing properly money and position management is. If you have trouble with following or creating an ETF trading strategy you can have my ETF trading system for rising, falling and sideways markets traded automatically in your trading account.
Learn more here about my Automated Trading Systems
See you in the market!
Chris Vermeulen
Sign up for one of our Free Trading Webinars....Just Click Here!
Sunday, December 8, 2013
Christmas Rally Starts Monday....My ETF Trading Strategies
Our trading partner Chris Vermeulan says "Tis the Season for the most powerful seasonality trade of the year". Do you agree?
 With
the stock market up big in 2013 and most participants are speculating
on a pullback in the next week or two, Chris says he is on the other
side of that bet. Being a technical trader he focuses on patterns,
statistics and probabilities to power his ETF trading strategies.
So with 37 years of stats the seasonality chart of the S&P 500 index
paints a clear picture of what is likely to happen in December.
With
the stock market up big in 2013 and most participants are speculating
on a pullback in the next week or two, Chris says he is on the other
side of that bet. Being a technical trader he focuses on patterns,
statistics and probabilities to power his ETF trading strategies.
So with 37 years of stats the seasonality chart of the S&P 500 index
paints a clear picture of what is likely to happen in December.
If you do not know how to read a seasonality chart, Chris will explain it as its very simple. Simply put, it shows what the index has done on average through each month over the past 37 years. December typically has the strongest up trend and probability of happening any other time of the year.
The Big Board – NYSE
The NYSE also referred to as the Big Board, is an index with the largest brand name companies. Most individuals do not follow this, but to Chris its as close to the holy grail of trading than anything else he uses. he uses many different data points from this index (momentum, order flow, trend) for his ETF trading strategies.
Let's take a look at what Chris says the seasonality chart his telling us as we close our 2013 and move into 2014......Click here to check out "Christmas Rally Starts Monday....My ETF Trading Strategies"
 With
the stock market up big in 2013 and most participants are speculating
on a pullback in the next week or two, Chris says he is on the other
side of that bet. Being a technical trader he focuses on patterns,
statistics and probabilities to power his ETF trading strategies.
So with 37 years of stats the seasonality chart of the S&P 500 index
paints a clear picture of what is likely to happen in December.
With
the stock market up big in 2013 and most participants are speculating
on a pullback in the next week or two, Chris says he is on the other
side of that bet. Being a technical trader he focuses on patterns,
statistics and probabilities to power his ETF trading strategies.
So with 37 years of stats the seasonality chart of the S&P 500 index
paints a clear picture of what is likely to happen in December.If you do not know how to read a seasonality chart, Chris will explain it as its very simple. Simply put, it shows what the index has done on average through each month over the past 37 years. December typically has the strongest up trend and probability of happening any other time of the year.
The Big Board – NYSE
The NYSE also referred to as the Big Board, is an index with the largest brand name companies. Most individuals do not follow this, but to Chris its as close to the holy grail of trading than anything else he uses. he uses many different data points from this index (momentum, order flow, trend) for his ETF trading strategies.
Let's take a look at what Chris says the seasonality chart his telling us as we close our 2013 and move into 2014......Click here to check out "Christmas Rally Starts Monday....My ETF Trading Strategies"
Weekly Futures Market Recap - SP 500, Bonds, Gold, Coffee

The S&P 500 rose sharply this Friday afternoon after finishing lower for 5 consecutive trading days which is very rare in the month of December as this Friday afternoon prices finished up 19 points at 1803 and remember the fact we have not have a down day on a Friday since early October as Friday generally is a positive up day going into the weekend.
I’ve been recommending a long position in the S&P 500 for quite some time I do believe we will continue to move higher possibly up to the 1850 level here by New Year’s as there’s no other game in town with excellent earnings and the possibility of tapering coming after the monthly unemployment number which showed 203, 000 new jobs with an unemployment rate of 7.0% which was considered very bullish despite the fact that there could be tapering of US bonds soon , but that story is becoming old sending prices sharply higher right near all time highs once again.
The NASDAQ 100 is up 25 points at 3503 despite the fact that Apple Computer was down nearly $8 as investors are still in love with the technology sector especially after a minor setback that it had the last week and I still suggest you be bullish either with options or outright futures positions. The NASDAQ 100 cash index I believe will break 4500 which is the next stop which will take a couple of months in my opinion but prices remain strong.
Both of these markets are still trading above their 20 and 100 day moving average despite the five day losing streak & that just shows you how far prices have comes to the upside and I do think there’s more good news around the world which should prop up stock prices especially with low interest rates in Europe and the Japanese continuing their QE programs which will prop up the Nikkei so across the world bullish news will continue to push equity prices higher.
Bond Futures
The 5 year note sold off sharply this Friday afternoon hitting a 6 week low before rallying to finish down 3 ticks at 120-08 as the monthly unemployment was construed bullish the stock market and bearish bonds because of the possibility of tapering. I'm recommending a short position in the five year note as the government cannot continue to print forever and one day if you're a long-term investor this will pay off as interest rates will start to rise eventually as the five year note is only yielding 1.50% at the present time. This is an excellent market with low volatility compared to many of the other commodity markets and it has excellent chart structure and I'm recommending outright futures contract to the downside & If you are long term investor I would continue to sell the five year note futures and I would not place a stop because I would hold on continuing to rollover for years to come because the five year note eventually could go back up to 4% or 5% which would be a huge gain if you are short the futures for the entire time and that could take several years but will pay you off in the long run in my opinion. The five year note is now trading below its 20 and 100 day moving average and it looks like a possible head and shoulders top has been formed so take a shot at the downside.
The 10 year note is currently trading at 124-09 in the March contract finishing lower for the 3rd straight trading session and it also looks like its topped out so I'm recommending a short position placing your stop above 125.20 risking around $1,500 per contract as I do think prices will retest at 120 level down the road as the yield on the 10 year stands at 2.89% as people are rotating out of bonds and continue to pour money into the S&P 500 which I think will continue for the rest of the year so sell rallies in the bond market. Trend....mixed. Chart Structure....excellent.
Gold Futures
The monthly unemployment report came out at this morning stating that we added 203, 000 new jobs which was construed very bullish sending the stock market higher and gold lower due to the fact of tapering possibly happening as soon as March as the unemployment rate is now 7.0% as traders see no reasonable to own gold as the economy here in the United States and around the world are improving dramatically sending the S&P right near record highs once again today and selling off gold by $4 at 1,228 currently here on the night session this Friday afternoon in New York. Gold is trading below its 20 & 100 day moving average continuing its bearish trend hitting a 5 month low with major support at 1,210 which was hit twice this week and rebounded but it looks to me that we almost certainly have to retest 1,180 which was last summer’s low. Trend lower....Chart structure....excellant.
Coffee Futures
Coffee in the March contract closed down over 450 points this week at 106.40 reversing earlier gains hitting a 4 week high at 1 point trading up at 112.90 on Wednesday before a major reversal sent it right back down into its recent trading range as many the commodity markets were sharply higher this week but the coffee fundamentals still at this time remain bearish. If your bullish coffee prices as we’ve have had a nice sideways channel for over 4 weeks and that’s what to look for in a bottoming pattern so my recommendation would be to buy a futures contract at today’s price placing a stop below the contract low at 104 risking around $1,100 per contract but I remain neutral on coffee because there really is no trend right now. It would not surprise me if you get a snap back to the upside like we’ve gotten in oil, gold, and silver prices today as massive short covering is taking place and that could happen in coffee as well because of the short interest currently. Trend....neutral. Chart structure excellent.
Check out more of Mike's calls and subscribe to his newsletter at INO.com
Sign up for our three part training session "Diversify, use history,trade gold"
Friday, November 15, 2013
Option Probabilities Spell Possible Trouble for Treasury’s
Our trading partner J.W. Jones is coming at us today with a great post on where he sees the Treasury ETF TLT headed. Great guidance for where the market at large just might be headed.....
 The incredible rally in equities in 2013 has begun to stir concern among many that the stock market is now in a bubble. We have entered the euphoric stage of this bull market and equity prices cannot and will not go lower according to some talking heads in the financial punditry.
While chatter is starting to heat up that equities are in a bubble, the real bubble seems to be ignored for the most part. The larger, more concerning bubble is in the Treasury marketplace where the Federal Reserve continues to print money to purchase treasury bonds to help keep interest rates artificially low.
Instead of debating the bubbles in Treasury’s versus equities, or trying to predict when the bubble in either asset class may pop, I want to focus on the near term for price action expectations in longer dated Treasury bonds.
Here is a weekly chart of the Treasury ETF TLT which is supposed to reflect the price action and yield generation of a portfolio of 20+ year duration Treasury bonds issued by the U.S. federal government.....Read "Option Probabilities Spell Possible Trouble for Treasury’s"
"Wall Streets Best Kept Secret....Now you are in the loop"
Thursday, October 24, 2013
Precious Metals: Gold, Silver and Miners Are Trapped
The precious metal market has been stuck in a strong down trend since 2012. But the recent chart, volume and technical analysis is starting to show some signs that a bottom may have already taken place.
This report focused on the weekly and monthly charts which allow us to see the bigger picture of where the precious metals sector stands in terms of its trend. Let’s take a look at a few charts below for a quick overview, but if you want more interesting ...... Click here to Read More.
This report focused on the weekly and monthly charts which allow us to see the bigger picture of where the precious metals sector stands in terms of its trend. Let’s take a look at a few charts below for a quick overview, but if you want more interesting ...... Click here to Read More.
Friday, September 13, 2013
Coffee Holds Above 20 Day Moving Average....you in?

However we are sticking our neck out here and are advising traders to get long this market placing a stop loss at 114 risking around $2000 per contract as coffee is now trading above its 20 day moving average but below its 100 day moving average with outstanding chart structure & extremely low volatility.
Some of the best markets I’ve ever seen have been the ones that have no reason to go up or down and this market has absolutely no reason to move higher with massive supplies across the globe & crops doing extremely well at this time, but this news is already priced into the market and one day this market will start to turn to the upside it’s just a matter of when.
TREND: MIXED – CHART STRUCTURE: EXCELLENT
Don't miss the second video in this weeks series "The Truth about Trading the Trend"
Friday, May 17, 2013
Is it finally time to go long coffee?
If you have been following us you know we have been adding to our long coffee position using ticker "JO". Are you on board or do you see coffee going lower. Coffee bears have gained back some momentum the last couple of days. Today we've asked our friend Jim Robinson at INO.com to provide his expert analysis of the coffee trade to our readers. Each week he'll be be analyzing a different chart for us using our Trade Triangles and his experience.....
Coffee could be turning bullish, so this week let's take a look at the Coffee Chart. With Futures we use the weekly MarketClub Trade Triangle for trend, and the daily MarketClub Trade Triangle for timing.
* Coffee put in a weekly green Trade Triangle on what looks to be the breakout to the upside of the base.
* Coffee put in a daily red Trade Triangle on what looks to be a test of the base.
* If Coffee trades higher and puts in a green daily Trade Triangle odds would be with bulls.
The MACD made a bullish momentum divergence at the lows and is currently on a buy signal, which supports the bullish case for Coffee as of right now. If Coffee were to continue lower from here and puts in a red weekly MarketClub Trade Triangle, then odds would not be with the bullish case for Coffee any more.
So even though it looks to be a big bullish opportunity for Coffee, we'll just have to sit back and let the market tell us what to do next. So this looks to be a great Chart to Watch right now, as exciting things could be happening on the upside in Coffee soon.

Just click here to get a FREE trial of the Trade Triangle Technology that we are using!
The Bible for Commodity Traders....Get our free eBook now!
Coffee could be turning bullish, so this week let's take a look at the Coffee Chart. With Futures we use the weekly MarketClub Trade Triangle for trend, and the daily MarketClub Trade Triangle for timing.
* Coffee put in a weekly green Trade Triangle on what looks to be the breakout to the upside of the base.
* Coffee put in a daily red Trade Triangle on what looks to be a test of the base.
* If Coffee trades higher and puts in a green daily Trade Triangle odds would be with bulls.
The MACD made a bullish momentum divergence at the lows and is currently on a buy signal, which supports the bullish case for Coffee as of right now. If Coffee were to continue lower from here and puts in a red weekly MarketClub Trade Triangle, then odds would not be with the bullish case for Coffee any more.
So even though it looks to be a big bullish opportunity for Coffee, we'll just have to sit back and let the market tell us what to do next. So this looks to be a great Chart to Watch right now, as exciting things could be happening on the upside in Coffee soon.
Just click here to get a FREE trial of the Trade Triangle Technology that we are using!
The Bible for Commodity Traders....Get our free eBook now!
Wednesday, February 27, 2013
Playing the ABC Gap fill for swing trading entry at ATP
From guest analyst David Banister....
One of my favorite “Crowd Behavioral” patterns is the ABC Gap fill pattern. This is a normal correction pattern in the stock market that works off overbought sentiment. You can apply this to liquid individual stocks in most cases, and look ahead to spot potential entries on your watch list for trading.
A sample we will use today is KORS, a fast growth stock of the leading luxury retailer Michael Kors. We notified our subscribers several days in advance to watch for a gap fill at $57 on this stock before entering a long trade. We also spotted what looked like a classic C wave pattern coming down from a B wave interim top.
Sure enough it took several days but the stock worked its way down to $57 and hit the gap on the nose on February 26th. It immediately reversed to end the day $2.25 higher or about 4-5% swing gains on this pattern. The chart below shows a 1, 2, 3, and 4 pattern with ABC making up the 4 pattern on KORS stock.

At ATP, we look for ABC and other patterns in growth plays and swing trade them long for reversals, just as the crowd of traders has stopped out and gone sour on the stock. Consider joining us by learning more at The Active Trading Partners.com
Get our low risk entry points and broad market technical analysis!
Tuesday, May 1, 2012
Will Crude Oil Break Through Support This Week?
Get Today's 50 Top Trending Stocks
The June crude oil market rallied every day last week. The market put in higher lows and higher highs on a daily basis after it tested the support trendline (#3 on the chart) last week on Monday morning. Any technical trader would say last week had all of the necessary ingredients for a bull run.
On Monday crude oil was under pressure following unfavorable reports out of Spain and the United States coupled with profit taking ahead of a Labor Day Holiday in Europe and Asia.
The selloff seemed to be targeting the dominant trendline and the 20 day moving average (#1 on the chart) above the highs on the daily chart that kept Crude Oil in a downward channel until Thursday of last week when it closed above. This line was the dominant resistance for months, and may be the dominant support if the market can stay above in the near term.
If oil does not sell off any further, the near term target would likely be a price of $105.50. This price is where the high price from April 17th and the upper resistance trendline will converge on the chart (#2 on the chart). Closes above this number should be seen as a very bullish signal.
Any closes below #3 on the chart would likely invite heavy selling pressure on the June crude oil, as it would signal a break in the support trendline that the market has held since December 2011.
Friday, January 13, 2012
ONG: Sharp Move Dominates Oil Market, Bears Take the Momentum
Sharp moves dominated yesterday's session, where oil rallied to acquire our targeted area near 103.00 before reversing sharply again to breach the bearish technical pattern shown on image in addition to 100.10 support. Currently, price is testing the breached level again which turns into resistance after testing the main pivotal support at 98.50, but in general, trading remain within the same ranging stance. Today we may see another downside attempt as important technical levels were breached yesterday. The trading range for the day is expected among the major support at 96.00 and the major resistance at 102.00. The short term trend is to the downside with steady daily closing below 105.00, targeting 65.00.
Posted courtesy of Oil N' Gold | |||||||||||||||||||||||||||||||||||||||||||||||||||||||||||||||||||||||||||||||||||||||||||||||||||||||||||||||||||||||||||||||||||||

Could Crude Oil Prices Intensify a Pending SP 500 Sell Off?
Saturday, November 12, 2011
It's Make or Break Time For Crude Oil....And Your Vote is?
Short of a lifetime or a new bull run in the making. Thoughts?

Chart posted courtesy of The Slope of Hope, please join the conversation there as well.
Chart posted courtesy of The Slope of Hope, please join the conversation there as well.
Subscribe to:
Posts (Atom)
