Showing posts with label trade. Show all posts

Saturday, May 9, 2015

Mike Seerys Weekly Crude Oil, Gold, Coffee and Corn Markets Recap

Our trading partner Michael Seery is back this week to give our readers a weekly recap of the futures market. Mike has been Senior Analyst for close to 15 years and has extensive knowledge of all of the commodity and option markets.

Crude oil futures in the June contract are trading below their 20 and 100 day moving average as I have been sitting on the sidelines for the last several months in this market but if have a long futures position I would continue place your stop loss above the 10 day low which stands at 56.00 however in my opinion I think prices have topped out.

Strong demand and a very weak U.S dollar have pushed crude oil prices up from a contract low around $46 a barrel to around $63 in Wednesdays trade which has been a remarkable rally in my opinion but I think this market is overextended so I’m still going to remain sitting on the sidelines waiting for better chart structure to develop as this market will remain volatile for the rest of 2015 in my opinion giving you many trading opportunities.

Many of the commodity markets rallied in recent weeks as the U.S dollar is hitting a 3 month low which has been very supportive, however with record supplies overhanging that should keep a lid on prices at this point in time but I just don’t know where short term prices are headed so I’m looking at other markets that are beginning to trend.
Trend: Higher
Chart Structure: Solid

Get our latest FREE eBook "Understanding Options"....Just Click Here!

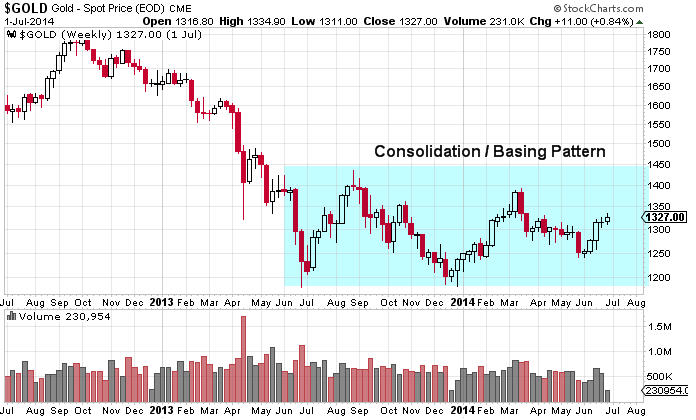
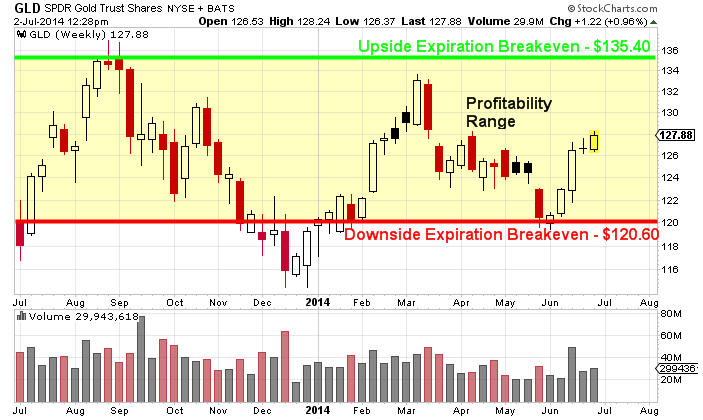
Gold futures settled last Friday at 1,174 an ounce while currently trading at 1,185 in a relatively quiet trading week while still trading below its 20 and 100 day moving average continuing its lower to choppy trend as the true breakout does not occur on the upside until 1,225 is broken or on the downside at 1,170 as I remain neutral at the current time.

The chart structure is starting to improve as gold prices have gone sideways for the last six weeks consolidating the recent down move as the U.S dollar is hitting a three month low and has been supporting gold and silver in recent weeks so be patient and keep an eye on this market at the current time. The monthly unemployment came out strong stating that the unemployment rate is 5.4% sending the stock market sharply higher as I’m surprised that gold futures are not lower this afternoon as the interest rates in the United States have been on the rise sending volatility into the commodity markets as I still see no reason to own gold at the current time but currently this market is stuck in a consolidation and in my opinion it’s very difficult to make money when a trend is not in sight.
Trend: Mixed
Chart Structure: Improving

Have you checked out our "April/May Safe Haven Play".....Just Click Here

Coffee futures in the July contract are higher by 300 points this Friday afternoon currently trading at 134.70 a pound after settling last Friday at 134.20 in a very nonvolatile trading week. I have been recommending a short position when prices broke 135 in last week’s trade and if you took that recommendation place your stop loss above the 10 day high which currently stands at 144 risking around 1000 points or $3,800 per contract plus slippage and commission.

The chart structure will improve dramatically next week helping lower monetary risk as prices are still trading below their 20 and 100 day moving average telling you that the trend is to the downside as big production could come out of Brazil which could send prices in my opinion as low as 100 a pound as the Brazilian Real has strengthened against the U.S dollar in recent weeks, but still remains in a long-term bear market which is negative for anything grown in Brazil.

The next level of support is Wednesdays low around 130 as many of the soft commodities were higher this Friday afternoon so continue to play this to the downside in my opinion as I think the risk/reward is in your favor.
Trend: Lower
Chart Structure: Excellent

This Chart Must Be Broken Before a Bear Market Can Be Confirmed

Corn futures in the December contract are trading below their 20 and 100 day moving average after settling last Friday in Chicago at 3.80 a bushel while currently trading at 3.79 down slightly for the trading week as 55% of the crop has already been planted with expectations for this Monday’s crop report as high as 85% as the weather in the Midwestern part of the United States is excellent and especially in the state of Illinois. I have been recommending a short position when corn prices broke 3.95 a bushel and if you took that trade place your stop loss above the 10 day high which currently stands at 3.87 risking around $.8 or $400 from today’s price level plus slippage and commission as the chart structure remains outstanding.

Expectations of this year’s crop are around 13.6 billion bushels which is 500 million bushels less than last year, however carry over levels are very large coupled with a strengthening dollar compared to last year as I still remain bearish especially as the weather remains ideal, however it’s an extremely long growing season as we usually do get some type of weather scare to the upside due to hot and dry weather forecasts, however the trend is your friend and the weather forecasts are bearish.

Traders await next week’s USDA crop report which definitely can send volatility back into this market but weather is the main focus at this time as we head into the hot and dry summer season which can send volatility into this market as we suffered a drought in 2012 sending prices to a record high of around $8.50 so make sure you place the proper amount of contracts while also placing the proper stop loss.
Trend: Lower
Chart Structure: Excellent

Get more of Mikes call on Wheat, soybeans, silver, sugar, cotton and more.....Just Click Here


Wednesday, February 18, 2015

Simple Strategy Alert: Premium Decay

We all think we know what premium decay is right? Well, I thought I knew how it worked until I watched this new video from our trading partner John Carter of Simpler Options. I never knew just how powerful and simple it was to apply knowledge of the decay principal to trading options.

Basically it's a way to insure the health of your portfolio even in an unhealthy market.

In this free video John shows us a simple and effective strategy for using premium decay, but he also shows you his strategy to make money on a stock whether it's going up or down.


Here's a sample of what John will share with us.....

  *  How to “control” stocks for a fraction of the price so you don’t risk all your capital - How you can
      generate consistent returns being dead wrong

  *  What “premium decay” is and how you can use to it to give yourself an edge in trading

  *  How you can set up occasional home run trades while generating consistent returns

  *  A handful of the key stocks I look at every day so you don’t go bug eyed looking for stocks to trade


Don't miss the game changing video "Simple Strategy Alert: Premium Decay"....Watch Video Now


John Carter has become well known for his wildly popular free options trading webinars and his free options trading eBook that changed the way traders looked at options trading in 2014.

Download the free eBook HereWhile you still can!

Wednesday, January 28, 2015

Free Video Series: Enjoy all of John Carters Options Videos.....Before it's to Late

In 2014 our trading partner John Carter of Simpler Options changed the way traders look at trading options with his free and easy to understand videos and webinars that taught all of us how to put his methods to work.

In February John is preparing to do it all again by bringing us a new series and most likely all of his current videos will be taken offline. So we want to make sure you get to watch them all while you can.

Just click on the titles to access videos......

    My Favorite ways to Trade Options on ETF’s

    What the Market Makers Don’t Want You to Know

    High Frequency Trading….the effect the Rise of the Machines has on ...
    What's Behind the BIG Trade, How to Grow a Small Account into a Big...

Make sure to also get John's free eBook "Understanding Options" > Just Click Here

See you in the markets!
Ray C. Parrish

Wednesday, December 10, 2014

Seven Questions Gold Bears Must Answer

By Jeff Clark, Senior Precious Metals Analyst

A glance at any gold price chart reveals the severity of the bear mauling it has endured over the last three years. More alarming, even for die hard gold investors, is that some of the fundamental drivers that would normally push gold higher, like a weak U.S. dollar, have reversed.

Throw in a correction defying Wall Street stock market and the never ending rain of disdain for gold from the mainstream and it may seem that there’s no reason to buy gold; the bear is here to stay.
If so, then I have a question. Actually, a whole bunch of questions.

If we’re in a bear market, then…..

Why Is China Accumulating Record Amounts of Gold?


Mainstream reports will tell you Chinese imports through Hong Kong are down. They are.
But total gold imports are up. Most journalists continue to overlook the fact that China imports gold directly into Beijing and Shanghai now. And there are at least 12 importing banks—that we know of.
Counting these “unreported” sources, imports have risen sharply. How do we know? From other countries’ export data. Take Switzerland, for example:


So far in 2014, Switzerland has shipped 153 tonnes (4.9 million ounces) to China directly. This represents over 50% of what they sent through Hong Kong (299 tonnes).

The UK has also exported £15 billion in gold so far in 2014, according to customs data. In fact, London has shipped so much gold to China (and other parts of Asia) that their domestic market has “tightened significantly” according to bullion analysts there.

Why Is China Working to Accelerate Its Accumulation?


This is a growing trend. The People’s Bank of China released a plan just last Wednesday to open up gold imports to qualified miners, as well as all banks that are members of the Shanghai Gold Exchange. Even commemorative gold maker China Gold Coin could qualify to import bullion. Not only will this further increase imports, but it will serve to lower premiums for Chinese buyers, making purchases more affordable.

As evidence of burgeoning demand, gold trading on China’s largest physical exchange has already exceeded last year’s record volume. YTD volume on the Shanghai Gold Exchange, including the city’s free trade zone, was 12,077 tonnes through October vs. 11,614 tonnes in all of 2013.

The Chinese wave has reached tidal proportions—and it’s still growing.

Why Are Other Countries Hoarding Gold?


The World Gold Council (WGC) reports that for the 12 months ending September 2014, gold demand outside of China and India was 1,566 tonnes (50.3 million ounces). The problem is that demand from China and India already equals global production!

India and China currently account for approximately 3,100 tonnes of gold demand, and the WGC says new mine production was 3,115 tonnes during the same period.

And in spite of all the government attempts to limit gold imports, India just recorded the highest level of imports in 41 months; the country imported over 39 tonnes in November alone, the most since May 2011.

Let’s not forget Russia. Not only does the Russian central bank continue to buy aggressively on the international market, Moscow now buys directly from Russian miners. This is largely because banks and brokers are blocked from using international markets by US sanctions. Despite this, and the fact that Russia doesn’t have to buy gold but keeps doing so anyway.

Global gold demand now eats up more than miners around the world can produce. Do all these countries see something we don’t?

Why Are Retail Investors NOT Selling SLV?


SPDR gold ETF (GLD) holdings continue to largely track the price of gold—but not the iShares silver ETF (SLV). The latter has more retail investors than GLD, and they’re not selling. In fact, while GLD holdings continue to decline, SLV holdings have shot higher.


While the silver price has fallen 16.5% so far this year, SLV holdings have risen 9.5%.

Why are so many silver investors not only holding on to their ETF shares but buying more?

Why Are Bullion Sales Setting New Records?


2013 was a record-setting year for gold and silver purchases from the US Mint. Pretty bullish when you consider the price crashed and headlines were universally negative.
And yet 2014 is on track to exceed last year’s record-setting pace, particularly with silver…
  • November silver Eagle sales from the US Mint totaled 3,426,000 ounces, 49% more than the previous year. If December sales surpass 1.1 million coins—a near certainty at this point—2014 will be another record-breaking year.
  • Silver sales at the Perth Mint last month also hit their highest level since January. Silver coin sales jumped to 851,836 ounces in November. That was also substantially higher than the 655,881 ounces in October.
  • And India’s silver imports rose 14% for the first 10 months of the year and set a record for that period. Silver imports totaled a massive 169 million ounces, draining many vaults in the UK, similar to the drain for gold I mentioned above.
To be fair, the Royal Canadian Mint reported lower gold and silver bullion sales for Q3. But volumes are still historically high.

Why Are Some Mainstream Investors Buying Gold?


The negative headlines we all see about gold come from the mainstream. Yet, some in that group are buyers…..

Ray Dalio runs the world’s largest hedge fund, with approximately $150 billion in assets under management. As my colleague Marin Katusa puts it, “When Ray talks, you listen.”

And Ray currently allocates 7.5% of his portfolio to gold.


He’s not alone. Joe Wickwire, portfolio manager of Fidelity Investments, said last week, “I believe now is a good time to take advantage of negative short-term trading sentiment in gold.”

Then there are Japanese pension funds, which as recently as 2011 did not invest in gold at all. Today, several hundred Japanese pension funds actively invest in the metal. Consider that Japan is the second-largest pension market in the world. Demand is also reportedly growing from defined benefit and defined contribution plans.

And just last Friday, Credit Suisse sold $24 million of US notes tied to an index of gold stocks, the largest offering in 14 months, a bet that producers will rebound from near six-year lows.

These (and other) mainstream investors are clearly not expecting gold and gold stocks to keep declining.

Why Are Countries Repatriating Gold?


I mean, it’s not as if the New York depository is unsafe. It and Ft. Knox rank as among the most secure storage facilities in the world. That makes the following developments very curious:
  • Netherlands repatriated 122 tonnes (3.9 million ounces) last month.
  • France’s National Front leader urged the Bank of France last month to repatriate all its gold from overseas vaults, and to increase its bullion assets by 20%.
  • The Swiss Gold Initiative, which did not pass a popular vote, would’ve required all overseas gold be repatriated, as well as gold to comprise 20% of Swiss assets.
  • Germany announced a repatriation program last year, though the plan has since fizzled.
  • And this just in: there are reports that the Belgian central bank is investigating repatriation of its gold reserves.
What’s so important about gold right now that’s spurned a new trend to store it closer to home and increase reserves?

These strong signs of demand don’t normally correlate with an asset in a bear market. Do you know of any bear market, in any asset, that’s seen this kind of demand?

Neither do I.

My friends, there’s only one explanation: all these parties see the bear soon yielding to the bull. You and I obviously aren’t the only ones that see it on the horizon.

Christmas Wishes Come True…..


One more thing: our founder and chairman, Doug Casey himself, is now willing to go on the record saying that he thinks the bottom is in for gold.

I say we back up the truck for the bargain of the century. Just like all the others above are doing.

With gold on sale for the holidays, I arranged for premium discounts on SEVEN different bullion products in the new issue of BIG GOLD. With gold and silver prices at four-year lows and fundamental forces that will someday propel them a lot higher, we have a truly unique buying opportunity. I want to capitalize on today’s “most mispriced asset” before sentiment reverses and the next uptrend in precious metals kicks into gear. It’s our first ever Bullion Buyers Blowout—and I hope you’ll take advantage of the can’t-beat offers.

Someday soon you will pay a lot more for your insurance. Save now with these discounts.
The article 7 Questions Gold Bears Must Answer was originally published at casey research.


Get our latest FREE eBook "Understanding Options"....Just Click Here!

Sunday, December 7, 2014

Crude Oil Market Summary for Week Ending Friday December 5th

Crude oil futures in the January contract had a wild trading week continuing a bearish trend after settling last Friday around 66.15 basically going out at the same price today and if you are still short this market I would continue to place my stop loss above the 10 day high which currently stands at 77.02 risking around 1100 points or $11,000 per contract plus slippage and commission as this is a high risk trade at the current time.

However if you are not currently short this market I would sit on the sidelines and look for a better trade. The chart structure will start to improve dramatically starting on Monday as the risk will come down dramatically as the trend continues with gold and crude oil to the downside as the commodity markets as a whole remain bearish as the U.S dollar hit another 5 year high today so continue to play this to the downside as I think the oversupply issue worldwide will put a lid on prices here in the short term.

Eastern Europe and Russia are both heading into recession while the United States economy is looking very solid as consumers will definitely benefit from lower prices at the pump which should continue to put upward pressure on the equity markets in my opinion, however with OPEC deciding last week not to cut production this market should continue to move to the downside as the chart structure has started to improve, however there is extreme volatility in this market at the current time with high risk so move on and do not try to pick a bottom as I’m not bullish crude oil prices at all.
Trend: Lower
Chart Structure: Improving

This weeks crude oil market summary was provided by our trading partner Mike Seery. Get more of his calls on commodities....Just Click Here

Get our latest FREE eBook "Understanding Options"....Just Click Here!

Sunday, November 30, 2014

Weekly Crude Oil, Dollar and Gold Market Summary for Week Ending Friday November 28th

Crude oil futures in the January contract are down $6 a barrel as OPEC announced on Thanksgiving that they will not cut production as the trade was expecting 1 million barrels to be cut sending prices to a 5 year low with the next major level of support all the way back to May 24th of the year 2010 at 67.15 and I still do believe with OPEC and Saudi Arabia definitely wanting lower prices that they will get their wish as prices remain bearish in my opinion. Crude oil futures are trading far below their 20 and 100 day moving average telling you that trend is lower and if you’re still short this market I would place my stop loss above the 10 day high which currently stands at 77.83 which is around 1000 points or $10,000 risk per contract plus slippage and commission as the chart structure now has turned terrible. The chart structure before today’s activity was very solid as the 10 day high was very close to where prices were trading, however when you move $5 lower in one day that’s what’s going to happen. If you’re not short this market I would sit on the sidelines because I think the risk is too high but definitely do not try and pick a bottom because who knows how low prices can actually go. The U.S dollar continues its bullish momentum up another 60 points today also contributing to a weaker energy market as the world is awash with energy supplies at the current time and you have to remember in 2008 prices traded around $35 a barrel and that was with a weak U.S dollar so prices still can head lower.
Trend: Lower
Chart Structure: Terrible

Get more of Mike Seerys Weekly Commodity Calls..,,..Just Click Here

The U.S dollar is rallying sharply this Friday afternoon currently trading at 88.42 in the December contract as I’ve been recommending a bullish position in the U.S dollar while placing your stop loss below the 10 day low which currently stands at 87.23 risking around $1,200 dollars plus commission and slippage per contract as the chart structure is outstanding at the current time. The U.S dollar is trading above its 20 & 100 day moving average telling you that the trend is to the upside as crude oil prices are down nearly $5 which is really putting pressure on several of the foreign currencies such as the Canadian dollar which is down 150 points and I still do believe we’re in a longer-term secular bull market in the U.S dollar. The European countries look to head into recession as the trend is your friend in the commodity markets so continue to play this to the upside while placing the proper stop loss while using the proper amount of contracts risking only 2% of your account balance on any given trade in case you are wrong. The strong U.S dollar is pressuring many commodity prices to the downside as the next major resistance is at 88.51 which was the most recent high hit last week and I do think prices will continue to move higher as investors feel much safer buying the U.S dollar than buying any other currency which are all seemingly in turmoil at the current time.
Trend: Higher
Chart Structure: Excellent

Investors 7 Year Financial Outlook....Take a Look at a Clear Visual of 7 Year cycle Highs and Lows

Gold futures this Friday afternoon after the Thanksgiving holiday are sharply lower due to the fact that crude oil prices are down nearly $5 also pressuring the precious metals to the downside as gold in the February contract is currently trading down $29 at 1,167 after settling last Friday at 1,198 as I still remain neutral in this market as prices are trading above their 20 day but still below their 100 day moving average so avoid this market at the current time. In my opinion choppy markets are difficult to trade as the longer term downtrend line in gold is still intact in my opinion as a strong U.S dollar and S&P 500 continue to take money out of gold as the money flow continues to go into those 2 sectors as I still think there’s a possible retest of 1,130 in the month of December and if you remember in 2013 December was also a negative month to the downside as the stock market in my opinion will continue to climb higher throughout the rest of the year. The chart structure in gold is poor at the current time as prices have been choppy in recent weeks so look for a better market to trade and keep an eye on this and hopefully better chart structure will develop over the course of the next several weeks but I’m feeling that we will not be involved in the gold market until at least early 2015.
Trend: Mixed
Chart Structure: Poor

Get our latest FREE eBook "Understanding Options"....Just Click Here!

Thursday, November 13, 2014

Paper Gold and Its Effect on the Gold Price

By Bud Conrad, Chief Economist

Gold dropped to new lows of $1,130 per ounce last week. This is surprising because it doesn’t square with the fundamentals. China and India continue to exert strong demand on gold, and interest in bullion coins remains high.

I explained in my October article in The Casey Report that the Comex futures market structure allows a few big banks to supply gold to keep its price contained. I call the gold futures market the “paper gold” market because very little gold actually changes hands. $360 billion of paper gold is traded per month, but only $279 million of physical gold is delivered. That’s a 1,000-to-1 ratio:

Market Statistics for the 100-oz Gold Futures Contract on Comex
Value ($M)
Monthly volume (Paper Trade) $360,000
Open Interest All Contracts $45,600
Warehouse-Registered Gold (oz) $1,140
Physical Delivery per Month $279
House Account Net Delivery, monthly $41


We know that huge orders for paper gold can move the price by $20 in a second. These orders often exceed the CME stated limit of 6,000 contracts. Here’s a close view from October 31, when the sale of 2,365 contracts caused the gold price to plummet and forced the exchange to close for 20 seconds:


Many argue that the net long term effect of such orders is neutral, because every position taken must be removed before expiration. But that’s actually not true. The big players can hold hundreds of contracts into expiration and deliver the gold instead of unwinding the trade. Net, big banks can drive down the price by delivering relatively small amounts of gold.

A few large banks dominate the delivery process. I grouped the seven biggest players below to show that all the other sources are very small. Those seven banks have the opportunity to manage the gold price:


After gold’s big drop in October, I analyzed the October delivery numbers. The concentration was even more severe than I expected:


This chart shows that an amazing 98.5% of the gold delivered to the Comex in October came from just three banks: Barclays; Bank of Nova Scotia; and HSBC. They delivered this gold from their in house trading accounts.

The concentration was even worse on the other side of the trade—the side taking delivery. Barclays took 98% of all deliveries for customers. It could be all one customer, but it’s more likely that several customers used Barclays to clear their trades. Either way, notice that Barclays delivered 455 of those contracts from its house account to its own customers.

The opportunity for distorting the price of gold in an environment with so few players is obvious. Barclays knows 98% of the buyers and is supplying 35% of the gold. That’s highly concentrated, to say the least. And the amounts of gold we’re talking about are small—a bank could tip the supply by 10% by adding just 100 contracts. That amounts to only 10,000 ounces, which is worth a little over $11 million—a rounding error to any of these banks. These numbers are trivial.

Note that the big banks were delivering gold from their house accounts, meaning they were selling their own gold outright. In other words, they were not acting neutrally. These banks accounted for all but 19 of the contracts sold. That’s a position of complete dominance. Actually, it’s beyond dominance. These banks are the market.

My point is that this market is much too easily rigged , and that the warnings about manipulation are valid. At some point, too many customers will demand physical delivery and there will be a big crash. Long contracts will be liquidated with cash payouts because there won’t be enough gold to deliver. I saw a few squeezes in my 20 years trading futures, including gold. In my opinion, the futures market is not safe.

The tougher question is: for how long will big banks’ dominance continue to pressure gold down?

Unfortunately, I don’t know the answer. Vigilant regulators would help, but “futures market regulators” is almost an oxymoron. The actions of the CFTC and the Comex, not to mention how MF Global was handled, suggest that there has been little pressure on regulators to fix this obvious problem.

This quote from a recent Financial Times article does give some reason for optimism, however:

UBS is expected to strike a settlement over alleged trader misbehaviour at its precious metals desks with at least one authority as part of a group deal over forex with multiple regulators this week, two people close to the situation said. … The head of UBS’s gold desk in Zurich, André Flotron, has been on leave since January for reasons unspecified by the lender…..

The FCA fined Barclays £26m in May after an options trader was found to have manipulated the London gold fix.

Germany’s financial regulator BaFin has launched a formal investigation into the gold market and is probing Deutsche Bank, one of the former members of a tarnished gold fix panel that will soon be replaced by an electronic fixing.

The latter two banks are involved with the Comex.

Eventually, the physical gold market could overwhelm the smaller but more closely watched U.S. futures delivery market. Traders are already moving to other markets like Shanghai, which could accelerate that process. You might recall that I wrote about JP Morgan (JPM) exiting the commodities business, which I thought might help bring some normalcy back to the gold futures markets. Unfortunately, other banks moved right in to pick up JPM’s slack.

Banks can’t suppress gold forever. They need physical gold bullion to continue the scheme, and there’s just not as much gold around as there used to be. Some big sources, like the Fed’s stash and the London Bullion Market, are not available. The GLD inventory is declining.


If a big player like a central bank started to use the Comex to expand its gold holdings, it could overwhelm the Comex’s relatively small inventories. Warehouse stocks registered for delivery on the Comex exchange have declined to only 870,000 ounces (8,700 contracts). Almost that much can be demanded in one month: 6,281 contracts were delivered in August.

The big banks aren’t stupid. They will see these problems coming and can probably induce some holders to add to the supplies, so I’m not predicting a crisis from too many speculators taking delivery. But a short squeeze could definitely lead to huge price spikes. It could even lead to a collapse in the confidence in the futures system, which would drive gold much higher.

Signs of high physical demand from China, India, and small investors buying coins from the mint indicate that gold prices should be rising. The GOFO rate (London Gold Forward Offered rate) went negative, indicating tightness in the gold market. Concerns about China’s central bank wanting to de-dollarize its holdings should be adding to the interest in gold.

In other words, it doesn’t add up. I fully expect currency debasement to drive gold higher, and I continue to own gold. I’m very confident that the fundamentals will drive gold much higher in the long term. But for now, I don’t know when big banks will lose their ability to manage the futures market.

Oddities in the gold market have been alleged by many for quite some time, but few know where to start looking, and even fewer have the patience to dig out the meaningful bits from the mountain of market data available. Casey Research Chief Economist Bud Conrad is one of those few—and he turns his keen eye to every sector in order to find the smart way to play it.

This is the kind of analysis that’s especially important in this period of uncertainty and volatility… and you can put Bud’s expertise—along with the other skilled analysts’ talents—to work for you by taking a risk-free test-drive of The Casey Report right now.

The article Paper Gold and Its Effect on the Gold Price was originally published at casey research


Get our latest FREE eBook "Understanding Options"....Just Click Here!


Thursday, October 30, 2014

Why Putin Has Been Able to Outwit America and Take Over the Global Energy Trade

By Casey Research
Vladimir Putin commands the utmost loyalty from those around him, whereas American politics is now characterized solely by infighting and self destructiveness. It’s this unity of purpose that explains how Putin and his St. Petersburg boys managed to rise to power from humble beginnings and why they’re winning the fight to control global energy trade. Putin is fiercely committed to restoring Russia’s superpower status using its vast energy resources as an economic weapon. Can American possibly compete?


Before Putin makes another move, pick up a copy of The Colder War and learn how his plans will directly affect you. You might even catch yourself admiring the man, save for the fact that all this is happening at our expense.


Get our latest FREE eBook "Understanding Options"....Just Click Here!

Sunday, September 7, 2014

Free Webinar: How to Beat the Market Makers Using Weekly Options

You’ve downloaded his free eBook and you have watched the video. Our trading partner John Carter is now going to make this perfectly clear with another one of his wildly popular free webinars, “How to Beat the Market Makers using Weekly Options”, this Tuesday September 9th at 8 p.m. EST

Click Here to get your reserved spot, they go fast!

In this free webinar John Carter will discuss…..

  *   How to determine the safe levels to take weekly options trades

  *   The best way to protect yourself and minimize risk while increasing the probability of maximum reward

  *   How to choose the right stocks for weekly options and which stocks you want to avoid like the plague

  *   A simple and powerful strategy that you can use whether you’re a beginner or advanced options trader

  *   How to consistently trade this current market using weekly options

And much more…

Sign Up for the Webinar Here

We’ll see you on Tuesday evening!

Ray C. Parrish
aka The Crude Oil Trader


Saturday, September 6, 2014

When Do You Enter A Trade? And what are your rules to initiate a trade on the long or short side of the commodity market?

Today we asked this question of our trading partner at INO.com, Mike Seery. When Do You Enter A Trade? And what are your rules to initiate a trade on the long or short side of the commodity market? And here's what he told us.....

I have been asked this question many times throughout my career and my opinion is simply to buy on a 20-25 day high breakout in price on a closing basis only or sell on a 20-25 day low breakout to the downside also on a closing basis. Many times the price will break the 25 day high and sell off later in the day only to have your trade be negative very quickly. I would rather buy the commodity at a higher price on the close because that gives me more confidence that the market has truly broken out. However there are more ways to skin a cat and this is not the only answer because some other trading systems might rely on different breakout rules that have also been reliable. Remember always keeping a 1%-2% risk loss on any given trade therefore minimizing risks because the entry system I use always goes with the trend because I have learned over the course of time the trend is truly your friend in the long run. I also look for tight chart structure meaning a tight trading range over a period of time with relatively low volatility. I try to stay away from a crazy market that hit a 25 day high in 2 trading sessions versus the 25 high that actually took 25 days to create.

So When do You Exit a Trade?

The biggest question that I have been asked is when do I exit a winning trade and when do I exit a losing trade? In my opinion the rule of thumb that I use is placing my stop loss at the 10 day high if I’m short or a 10 day low if I’m long. The other rule of thumb is to place your stop loss at the 2% maximum loss allowed in your account for any given trade.

Check out Mike's most recent call on commodities at INO/MarketClub


Make sure you watch this weeks video "What the Market Makers Don't Want You to Know"....Just Click Here!


Monday, July 7, 2014

Gold Option Trade – Will Gold Continue to Consolidate?

Until recently, the world has forgotten about gold and gold futures prices it would seem. A few years ago, all we heard about was gold and silver futures making new highs on the back of the Federal Reserve’s constant money printing schemes.

However, after a dramatic sell off the world of precious metals it became very quiet.


Gold prices have been in a giant basing or consolidation pattern for more than one year. As can clearly be seen below, gold futures prices have traded in a range between roughly 1,175 and 1,430 since June of 2013.


Chart1


The past few weeks we have heard more about gold prices as we have seen a five week rally since late May. I would also draw your attention to the fact that gold futures also made a slightly higher low which is typically a bullish signal.


At this point in time, it appears quite likely that a possible test of the upper end of the channel is possible in the next few weeks / months. If price can push above 1,430 on the spot gold futures price a breakout could transpire that could see $150 or more added to the spot gold price.


Clearly there are a variety of ways that a trader could consider higher prices in gold futures. However, a basic option strategy can pay handsome rewards that will profit from a continued consolidation. The trade strategy is profitable as long as price stays within a range for a specified period of time. Ultimately this type of trade strategy involves the use of options and capitalizes on the passage of time.


The strategy is called an Iron Condor Strategy, however in order to make this trade worth while we would consider widening out the strikes to increase our profitability while simultaneously increasing our overall risk per spread. Consider the chart of GLD below which has highlighted the price range that would be profitable to the August monthly option expiration on August 15th.


Chart2


As long as price stays in the range shown above, the GLD August Iron Condor Spread would be profitable. Clearly this strategy involves patience and the expectation that gold prices will continue to consolidate. This trade has the profit potential of $37 per spread, or a total potential return based on maximum possible risk of 13.62%. The probability based on today's implied volatility in GLD options for this spread to be profitable at expiration (August 15) is roughly 80%.


Our new option service specializes in identifying these types of consolidation setups and helps investors capitalize on consolidating chart patterns, volatility collapse, and profiting from the passage of time. And if you Advanced options trades are not your thing, we also provide Simple options where we buy either a call or put option based on the SP500 and VIX. The nice thing about buying calls and puts is that you can trade with an account as little as $2,500.


If You Want Daily Options Trades, Join the Technical Traders Options Alerts

See you in the markets!

Chris Vermeulen

Sign up for our next free trading webinar "Low VIX and What It Means to Your Trading"


Tuesday, June 10, 2014

Can Central Planners Revive China’s Economic Miracle?

By John Mauldin

For years, when asked whether I thought China would experience a hard landing, I would simply answer, “I don't understand China. Making a prediction would be pretending that I did, so I can’t.” The problem is that today China is the most significant macroeconomic wildcard in the global economy. To understand both the risks and the potentials for the future you have to reach some understanding of what is happening in China today. Last week we started a two part series on what my young associate Worth Wray and I feel is the significant systemic risk that China poses to global growth.

The first thing in my inbox this morning here in Tuscany was a note from a friend about the growing scandal in Quingdao. For a long time many of us have known that there has been “double counting” in the commodities trade sector in China, where local “entrepreneurs” create multiple warehouse receipts on which to borrow money cheaply, and then invest in what are essentially subprime securities that pay higher rates. Everyone “knows” that the government is not going to let anyone lose money on investments, so what could possibly go wrong? It turns out that Chinese warehouse officials are now emigrating in significant numbers to parts unknown around the world, armed with only their passports and whatever money they made through producing such bogus receipts.

My sources suggest that the size of the problem is approaching $1.3 billion (far greater than the number being bandied about in public reports). Since one of the guiding principles operative in any scandal is that there is never just one cockroach, I expect the ultimate losses to be far larger. And it appears that the People’s Bank of China is finally going to let people lose money on these fraudulent schemes. Good for them. But to suggest there is no risk in cleaning up corruption and fraud misses the point of our own subprime crisis. In a world where global economic trade and international banks are so intricately linked, trying to determine the actual risk to the system is difficult. And as I will note in my “final thoughts” section, corruption is a very real issue.

We are going to try gamely to finish with China today, having left at least three or four letters worth of copy on the editing floor. There is just so much information and misinformation to cover. I’m going to turn it over to Worth and then follow up with a few final thoughts of my own. (Please note that this letter will print exceptionally long as there are a number of charts and other graphics.) Now let’s do a deep dive into part two.

Can Central Planners Revive China’s Economic Miracle?

By Worth Wray
In my Thoughts from the Frontline debut this past March (“China’s Minsky Moment?”), I highlighted the massive bubble in Chinese private-sector debt and explored the near-term prospects for either (1) a reform-induced slowdown or (2) a crisis-induced recession. Unfortunately, it was not an easy or straightforward analysis, considering the glaring inconsistencies between “official” state compiled data and more concrete measures of all real economic activity, which is why I suggested that China is simultaneously the most important and most misunderstood economic force in the world today.

With the stakes now higher than ever, I returned to Asia’s “miracle” last week (“Looking at the Middle Kingdom with Fresh Eyes”) and probed deeper into the shadows (including China’s shadow banks) with the help of my new friend Leland Miller and a few illuminating excerpts from his Q1 2014 China Beige Book (the largest and most comprehensive survey series ever conducted on a closed or semi-closed economy).
Pulling back the Bamboo Curtain, Leland’s data revealed aspects of the Chinese economy that John and I could have only guessed at before, giving us a rare opportunity to explore regional contrasts in Chinese economic activity, to survey the modest (but still insufficient) rebalancing among sectors, and to identify a series of pressure points within the credit markets that suggest last summer’s interbank volatility may return in 2014.

Unfortunately, Leland’s key insights confirmed our fears that China’s consumption-repressing, debt-fueled, investment-led growth model is slowing down and starting to sputter… but not collapsing (at least not yet). 

What happens next – with huge implications for global markets – depends largely on the economic wisdom and political resolve of China’s central planners, who must find a way to gradually deleverage overextended regional governments and investment-intensive sectors while also rebalancing the national economy toward a consumption driven growth model.

Finessing the challenges will require not just one but a series of miracles.

Like Every Other Investment-Driven Growth “Miracle” 

After 34 years of booming economic growth averaging over 9% per year (the longest sustained period of rapid economic growth in human history), China’s credit-fueled, investment-driven growth model is exhausted and increasingly unstable. As you can see in the chart below, the Middle Kingdom’s credit boom is well past the point of diminishing marginal returns; and no one can deny that the misallocation is widespread, with capacity utilization now below 60%. (I should also note that Societe Generale’s Wei Yao has consistently published some of the best research on China in recent quarters; personally, I won’t be surprised to see her vault to rock-star status as the People’s Republic decelerates.)


Source: Wei Yao & Claire Huang, “SG Guide to China Reform.” Societe Generale Research, May 14, 2014.

Moreover, state perpetuated distortions in the cost and availability of financing are (1) funneling huge amounts of capital toward increasingly unproductive, state directed investments, and (2) pushing household and private business borrowers into the shadows, where the burden of substantially higher interest rates drags on household consumption.


Source: Wei Yao & Claire Huang, “SG Guide to China Reform.” Societe Generale Research, May 14, 2014.

It doesn’t require much imagination to connect the dots. Structural distortions in Chinese financial markets are a major cause of debt fueled overinvestment; and without sweeping structural reforms (along with a major crackdown on corruption at all levels of government), captive capital will continue to flow toward unproductive investments, capacity utilization will continue to fall, and China’s investment boom will continue its march toward a mega Minsky moment.

This kind of structural distortion is a classic symptom of an overextended investment boom and a warning sign that rebalancing – whether it’s induced by voluntary reforms or an involuntary debt crisis – will not be easy. The critical adjustments – gradual deleveraging and structural rebalancing – will require a greater slowdown in economic growth and a sharper fall in still-bubbly asset prices than China’s policymakers are letting on.

“This is not an easy task,” The Daily Telegraph’s Ambrose Evans Pritchard says, in a truly brilliant article published this week, “not least because land sales and taxes make up 39% of state revenue in China, and the property sector employs 20% of workers one way or another. It is clearly a bubble of epic proportions and already losing air. Mao Daqing from Vanke – China’s top developer – says total land value in Beijing has been bid up to such extremes that is on paper worth 61.6pc of America’s GDP. The figure was 63.3pc for Tokyo at the peak of the bubble in 1990.” Yikes.

As Peking University professor Michael Pettis explains in his 2013 book, Avoiding the Fall: China’s Economic Restructuring, “Every country that has followed a consumption-repressing, investment-driven growth model like China’s has ended with an unsustainable debt burden caused by wasted debt-financed investment. This has always led to either a debt crisis or a lost decade of very low growth.”
China’s “miracle” is no different from any other investment-driven growth binge where high levels of leverage (directly or indirectly paid for by the household sector), combined with high levels of fixed investment, eventually result in excessive and unsustainable debt loads. Pettis elaborates:

While these policies can generate tremendous growth early on, they also lead inexorably to deep imbalances. As demonstrated by the history of every investment-driven growth miracle, including that of Brazil, high levels of state-directed subsidized investment run an increasing risk of being misallocated, and the longer this goes on the more wealth is likely to be destroyed even as the economy posts high GDP growth rates. Eventually the imbalances this misallocation created have to be resolved and the wealth destruction has to be recognized. What’s more, with such heavy distortions imposed and maintained by the central government, there is no easy way for the economy to adjust on its own…. [Furthermore], Beijing [will] not be able to raise the consumption share of GDP without abandoning the investment-driven growth model altogether.

In other words, the world’s second largest economy is approaching its debt limit and the end of the line for investment led growth… but China’s financial system is structurally designed to prevent capital from flowing freely toward more productive uses. One way or another, the world’s largest contributor to global economic growth must slow down – either because Beijing has the foresight, resolve, and political capital to pursue aggressive economic and financial market reforms or because party elites fail to address the country’s structural imbalances and policy-induced distortions before the credit bubble pops. “Debt,” Pettis explains, “as we will learn over the next few years in China, has always been the Achilles’ heel of the investment-driven growth model…”

Which Way to Sustainable Growth?

Among the various reforms set forth in last November’s Communist Party Third Plenum, ranging from financial liberalization to a crackdown on corruption and pollution, the most challenging is the gradual deleveraging of the Chinese economy while simultaneously rebalancing the national economy toward a more sustainable, consumption-driven growth model.

To continue reading this article from Thoughts from the Frontline – a free weekly publication by John Mauldin, renowned financial expert, best-selling author, and Chairman of Mauldin Economics – Please Click Here.


Sign up for our new "2.0 Mentoring Program"....Just Click Here!


Sunday, June 1, 2014

Encore Presentation....."The Insiders Guide to Growing a Small Trading Account into a Big Account"

Thanks for all the positive feedback on John Carters webinar “The Insider’s Guide to Growing a Small Trading Account into a Big Account”. Many of you have requested an encore presentation. So we are happy to say that we’ll be hosting a "live" encore webinar on this Tuesday June 3rd

You can attend at either 1:00 pm or 8:00 pm New York time. Both webinars will be live encore presentations.

Just Click Here to Register

One of the reasons we are doing this is that it turns out that a lot of traders were shut out of last week’s webinar because we were over capacity. We apologize to all that were and hope you get a seat for this week. Make sure you log on 10 minutes early to claim your seat.

So join us for a live encore presentation on Tuesday.

Click Here to Choose the 1 p.m. Webinar

Click Here to Choose the 8 p.m. Webinar

See you on Tuesday!
Ray @ The Crude Oil Trader


Get ready for this weeks webinar by watching John's video primer "The Big Trade"


Saturday, May 10, 2014

Commodities Market Recap and this Weeks Stops and Trading Numbers....Crude Oil, Natural Gas, Gold, Silver, Coffee, Sugar and More!

We've asked our trading partner Michael Seery to give our readers a weekly recap of the futures market. He has been Senior Analyst for close to 15 years and has extensive knowledge of all of the commodity and option markets......


Crude oil futures are trading below their 20 day but still above their 100 day moving average stating that the trend is mixed as I am currently sitting on the sidelines as there is no trend currently. The fundamentals are bearish in oil as stock piles are at 85 year highs as prices peaked at 104 last month now looking at support between 97-98 dollars a barrel as I think lower prices are ahead however I am not currently participating in this market so wait for better chart structure to develop.
TREND: MIXED
CHART STRUCTURE: OK

Get our "Advanced Crude Oil Study – 15 Minute Range"

Natural Gas Futures. I had been recommending a long position in the June natural gas as prices broke down yesterday hitting a 10 day low and stopping us out of the market for a loss so sit on the sidelines and wait for better chart structure to develop. This was a disappointing trade as I thought prices were going to break above 5.00 but that did not happen so it’s time to lick your wounds and find a better trend.
TREND: MIXED
CHART STRUCTURE: SOLID

Gold futures in the June contract settled last Friday at 1,309 while going out today around 1,290 down by about $20 for the trading week as the Ukrainian situation has stalled sending gold prices back down into the recent trading range. Gold futures are trading below their 20 but right at their 100 day moving average as prices have been consolidating in the last 5 weeks trading in a $30 range as I’ve been sitting on the sidelines waiting for a better chart pattern to develop but if you are looking to get into this market on the long side I would buy at today’s prices placing my stop at the 10 day low of 1,365 risking around $2,500 per contract and if you’re looking to get short this market I would sell at today’s price while putting my stop loss at 1,310 risking around $2,000 as the chart structure is relatively tight at the current time. Gold prices rallied from 1,180 all the way up near $1,400 an ounce 2 months ago so this is basically the 50% retracement and I think you will see a consolidation for quite some time so keep a close eye on this chart as it appears to me that a breakout is looming.
TREND: MIXED
CHART STRUCTURE: EXCELLENT

Is it Time to Admit That Gold Peaked in 2011?

Silver futures in New York continued their bearish trend this week settling last Friday at 19.55 finishing lower by about $.45 for the trading week as I still think there’s a possibility that a spike bottom occurred in last Fridays trade as $19 has been very difficult to break on the downside. Silver futures have come all the way from slightly above $22 in late February all the way down to today’s level and from $35 in 2013 so this is been a bear market for well over 1 year as there seems to be a lack of interest, however eventually silver will turn around and join the rest of commodities higher but at this point there’s just very little interest. Silver futures are trading below their 20 and 100 day moving average telling you that the trend is lower and as I’ve talked about many times before if you have deep pockets and you’re a longer-term investor I think prices down at these levels are relatively cheap and if prices went lower I would continue to dollar cost average as there is real demand for silver.
TREND: LOWER
CHART STRUCTURE: EXCELLENT

Here's our Critical Line in the Sand for Silver

Coffee futures in the July contract were sharply lower this week finishing down over 1150 points this Friday afternoon to close around 184.00 a pound and I’ve been recommending a long position in coffee for quite some time as we got stopped out at the 194 level today which was the 2 week low so sit on the sidelines and wait for another trend to develop as prices could possibly retest the recent lows of around 170. Coffee futures are trading below their 20 day and above their 100 day moving average as the trend is sideways to lower currently so look for another market that is in a stronger trend but keep a close eye on this market as I do think prices are limited to the downside and I would be an interested buyer around the 165 level which was hit in early April. Coffee prices broke above to new contract highs 3 weeks ago but prices have just petered out here in recent weeks as crop estimates start to come out in the next several weeks.
TREND: MIXED
CHART STRUCTURE: POOR

Check out our Coffee Traders Facebook page

Sugar futures finished the week down around 20 points trading in nonvolatile action as prices are testing support at 17.07 settling this Friday at 17.20 and if that level is broken then I would place my stop loss above the 10 day high which stands at 18.03 risking around 100 points or $1,100 dollars per contract. The chart structure is excellent at the current time as the trend is lower as prices are trading below their 20 & 100 day moving averages as prices have been in a 100 point trading range over the last month so keep a close eye on the 17 level for a possible short as the soft commodities have turned negative recently. TREND: MIXED
CHART STRUCTURE: OUTSTANDING

Why Are So Many Boomers Working Longer?

When Do You Add To Your Winning Trade? This has always been a very interesting question because it can create a situation of going from rags to riches or from riches to rags in a very short amount of time. Many times I see traders abuse pyramiding or adding to positions with utter lack of any type of money management system in place and letting it ride which usually ends up in a complete wipeout of capital and sometimes even worse.

Commodity prices can move very quickly with large gains or loses like we experienced in the 2008 crash of stock and commodity prices, so you always have to use stops and not fall in love or marry a position. In my opinion the answer to this question is add only once to the trade if that position has made you at least 2%-3% of your account balance while still having stop losses on all positions that equal 2% loss at a maximum risk. Remember your stop loses will be different on both positions because of the fact that you entered those trades at a different date and price.

There are many different theories about how long does a meaningful consolidation have to last before you enter a trade on the breakout to the up or downside? In my opinion I always want to see a consolidation that lasts at least 8 or more weeks before I would consider entering. The reason that I want a longer consolidation is to try and avoid a bunch of false breakouts such as a 10 or 15 day consolidations which happen all the time, so I am trying to put the odds in my favor by trading the breakout of at least 8 weeks or more and the longer such as a 11 or 13 week consolidation the better. At this present time cocoa is in a major consolidation.

Want more call for this weeks commodity markets? Orange Juice, Wheat, Cotton, Cattle....Just Click Here!


Sign up for one of our Free Trading Webinars....Just Click Here!


Tuesday, April 22, 2014

New Video: This Weeks Nasdaq Shorting Opportunity

It looks as though the Nasdaq is about ready for another leg lower. Chris Vermeulen shows us what key resistance levels to look at for a possible short trade on the Nasdaq this week.

Get These Trade Alerts Every Week with Chris Vermeulen's ETF Trading Newsletter


Sign up for one of our Free Trading Webinars....Just Click Here!


Wednesday, April 9, 2014

Small Trading Accounts are Ideal for These Trading Methods

We have an important workshop to invite you to coming up on Thursday that really strives to put the opportunities the big guys benefit from into your hands. What was once unreachable is now in our grasp for small account traders.

Don't let the big stock names scare you! Sure, if you bought 100 shares of Apple, Google, Netflix and Amazon you'd need over $200K. But, there's a much better way for you, the individual trader to participate in these high flying opportunities.

This webinar is dedicated to 'everyday' folks starting out with a small account. In this webinar, you'll learn:

    *   Options Recommendations - top stock and ETF picks
    *   Risk Management Tips
    *   Ways to Increase Your Account and Scale
    *   Using Mini and Weekly Options to trade the big names for a fraction of the cost
    *   An exact road map to follow to start trading options now
    *   Minimize risk but still participate for maximum upside
    *   Strategies for the small account trader to use now with options and a trading system with training included

Want to know how to do it?

Successfully Trading Options with a Small Account - Including High Flying Tech Stocks!

This Thursday, April 10th, 2014
Three times to choose from....12 pm EDT / 9 am PDT / 4 pm GMT

Register Online Right Now

In this webinar, we'll teach you the finer points on how to trade big name stocks with small time capital.

Just Click Here to Reserve Your Logins for Thursday!

See you in the markets!

P.S. Can't make it on Thursday?  Reserve your seat anyways and we'll send you the recording! 


Here's a complete schedule of our Free Trading Webinars....Just Click Here!


Saturday, April 5, 2014

The Odds Are In Your Favor To Trade Gold This Quarter

Using MarketClub's weekly and daily Trade Triangles, I have found that over the last 6 1/2 years, the second quarter of the year has shown the most consistent profits in gold. These past results showed a quarterly gain on average of $7,104.83 on one futures contract.

Gold (XAUUSDO) enjoyed a nice move up earlier in the year, reaching a high of $1393.35 and has pulled back to an important Fibonacci support area. I want to watch this market very carefully and wait for the weekly Trade Triangle to turn green to get bullish on gold. That's not to say I am not longer term bullish, it only means that my timing will kick in when the weekly Trade Triangle turns into a green Trade Triangle.


Besides the Fibonacci support area, the RSI indicator is also at a very low level, similar to that of December 2013.

Trading Results

Q2 of 2008            $965.00
Q2 of 2009            $870.00
Q2 of 2010         $7,057.00
Q2 of 2011         $6,700.00
Q2 of 2012         $4,223.00
Q2 of 2013       $31,260.00
TOTAL             $42,629.00
AVE GAIN         $7,104.83

The results are based on signals using MarketClub's real time spot gold prices and margin of $8,333. This particular trading strategy and results are based on trading one futures contract, both from the long and short side. An ETF could be substituted, but I suspect the results would be quite different.

Trading Rules

How to use MarketClub's Trade Triangles to trade gold:

Use the weekly Trade Triangle to determine the major trend and initial positions. Use the daily Trade Triangles for timing purposes.

Gold entry and exit signals are generated from the spot Gold (XAUUSDO) chart.

Let me give you an example: if the last weekly Trade Triangle is GREEN, this indicates that the major trend is up for that market. You would use the initial GREEN weekly Trade Triangle as an entry point. You would then use the next RED daily Trade Triangle as an exit point. You would only reenter a long position if and when a GREEN daily Trade Triangle kicked in.

You would then use the next RED daily Trade Triangle as an exit point, provided that the GREEN weekly Trade Triangle is still in place and the trend is positive for that market. The reverse is true when you have a RED weekly Trade Triangle. You would use the initial RED weekly Trade Triangle as an entry point for a short position. You would then use the next GREEN daily Trade Triangle as an exit point.

Only Trade With Risk Capital

Even if the odds are in your favor, don't forget that there are no guarantees in trading and only funds that you can afford to lose should be used to trade with.

See you in the markets!
Adam Hewison

Make sure to catch Adam on INO TV


Sign up for one of our Free Trading Webinars....Just Click Here!


Friday, March 21, 2014

FREE WEBINAR: How To Trade Options – The Complete Roadmap

Join our trading partner Doc Severson for his next free webinar "How To Trade Options – The Complete Roadmap". Doc has made this easy by scheduling four live webinars, so just pick the time that fits your schedule best and register now.

Just click here to register now!

Doc has put together a short video explaining exactly what he is going to cover in this webinar.

Click here to watch the video now!

Here are just a few of the details........

    •    The real secrets that successful options traders won’t tell you!

    •    How a one trick pony loses every time

    •    How to prepare and profit from any market condition 

    •    How easy options trading can be with the right tools

    •    Why these four strategies will set you up for life

    •    How options trading can fit into your schedule…not vice versa.

    •    And one secret about volatility that could save your account

Watch the video now and please feel free to leave a comment and let us know what you think

See you in the markets!


FREE WEBINAR: How To Trade Options – The Complete Roadmap


Thursday, February 20, 2014

Being the Architect of your next "Big Trade"....This weeks FREE webinar!

This has been a BIG week for us and our trading partners. Last Tuesday John Carter of Simpler Trading treated us to a free webinar, "The Insiders Guide to the Big Trade", and once again he brought us another game changer.

This weeks webinar was over prescribed as 16,000+ investors and traders vied for a seat at this extremely popular class. And honestly, we got a lot of complaints as some traders logged on late only to find their seat had been taken.

John has heard you loud and clear so he added another webinar so don't wait. Sign up now, then make sure you get logged on 10 minutes before we get started.

It all starts this Tuesday, February 25th at 8:00 p.m. EST 

Get your seat now!

In this free online class we will share with you:

   *     The common thread these companies share

   *     How you can minimize your risk on these trades

   *     What time frames you should watch

   *     When to avoid the markets like the plague

   *     The best stocks to use – and why you need to trade options on them

          And much more…...

If you haven't seen it make sure to catch John's video from last week. He showed us some live trades in his actual account that puts some of these methods to work. One of these trades he shows us from January 14th is a definite must see!

John has also created another video this week that shows how he "puts" [pun intended] these methods to work. Tesla [ticker $TSLA] has been in the news. Let's see how John worked this trade, watch "Trading Tesla Puts" right now.

Just visit John's registration page and mark your calendar. 

See you on Tuesday, 
Ray @ The Crude Oil Trader


Register for "The Insiders Guide to the Big Trade"


Wednesday, January 15, 2014

Using 3X ETF's....Maybe this is now Doable

For years we have resisted using the 3X ETF's for our near term and day trading. These can potentially cut your head off over night. The main reason we have not been willing to use these tickers is that our traditional research including the resistance, support and pivot numbers just don't work.

But our friend and trading partner Chris Vermeulen is trying to convince us that he has it figured out. He has been telling us this for years but now he has created a program that....well, in all honesty looks like he was right.

Check out Chris new AlgoTrades Program

Here is his most recent trade using the ES Mini futures contract.....

On Jan 13th 2014 our algorithmic trading system took a long position in the SP500 futures trading contact. In less than 24 hours our algorithm system was able to identify resistance in the market the following session. This invisible overbought market condition which only our algorithmic trading system identified automatically sold 1/3rd of our long position for a quick $1100 profit and adjusted the protective stop to breakeven on the balance of the position.

Quick note: While this trade was executed on the ES mini futures contract using our futures trading system, we do have a 3x automated trading system for ETFs. We know the most of our followers and the general public prefer ETF trading because they understand them more and have less risk. So we built this 3x automated trading system using the 3 times leveraged exchange traded funds.

As of today (Jan 15th) we are sitting with a risk free trade, $1100 in realized gains, and another $2400 in gains on the remainder of our position. This type of trade setup has happened twice in the past 10 days. The first trade took $500 in profit and was stopped out the next day and now this trade.

Click here to read Chris' entire article and check out his chart work on this trade.


Don't miss Chris' 7 Steps to win with Logic


Stock & ETF Trading Signals